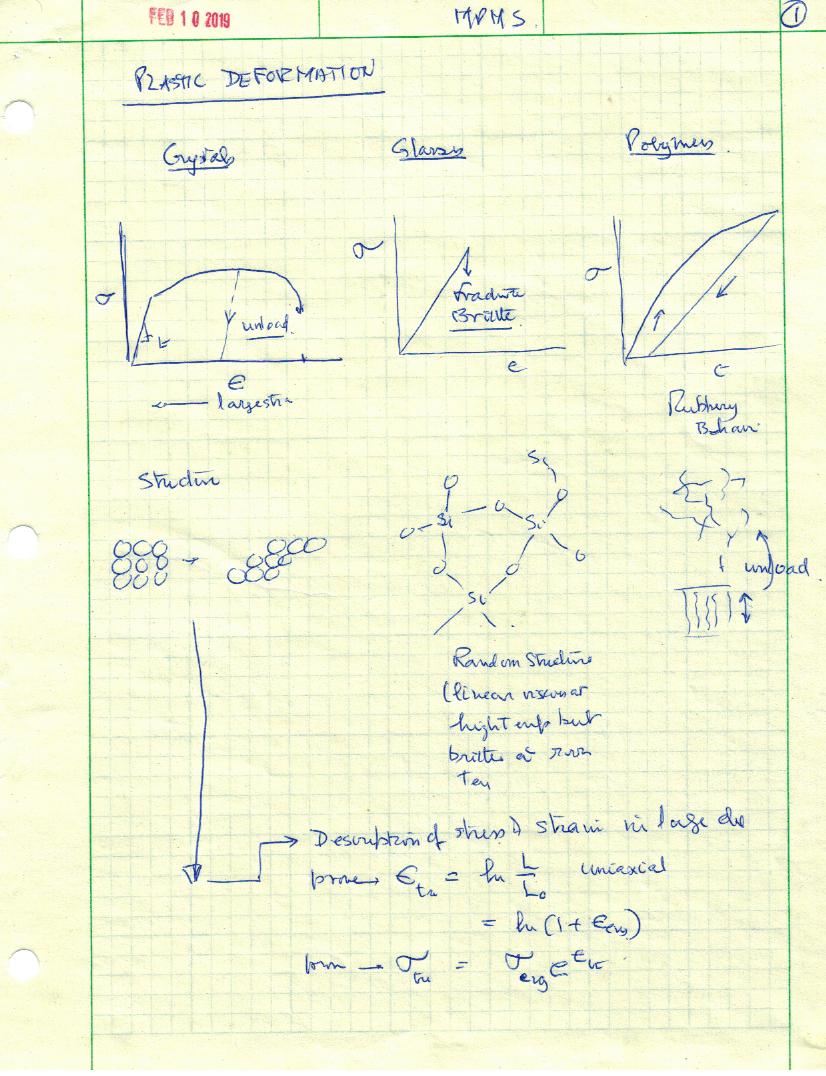
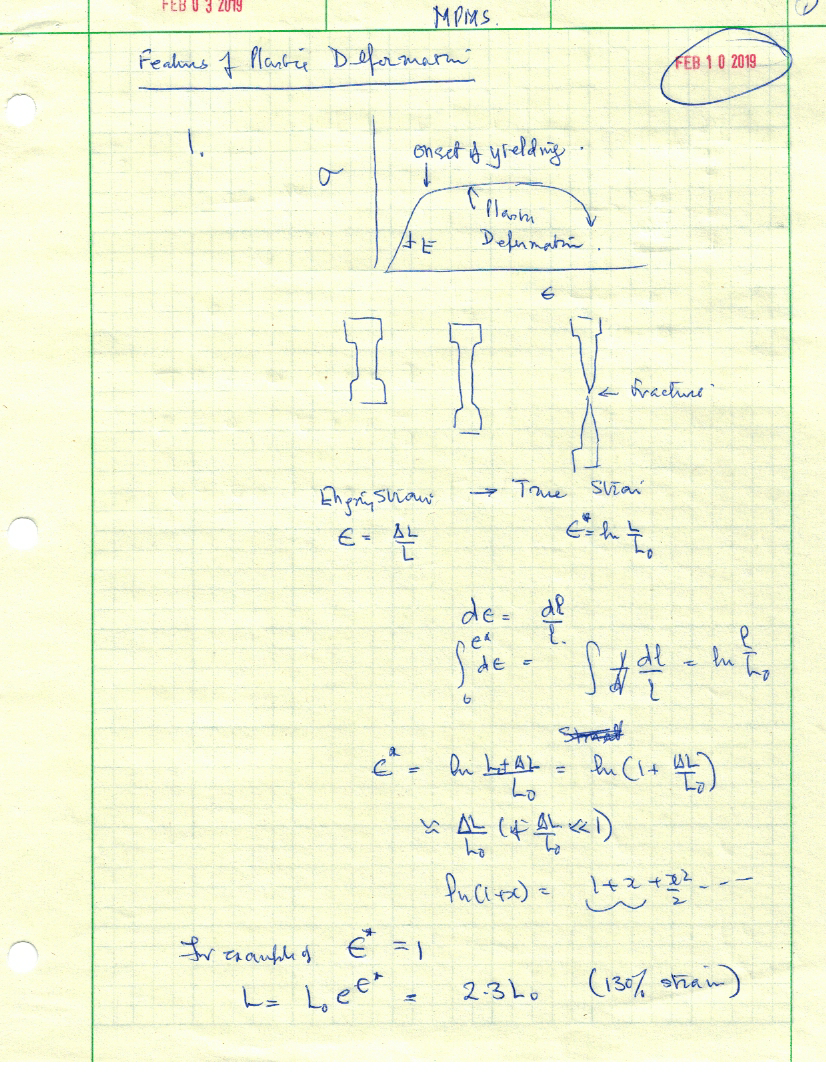
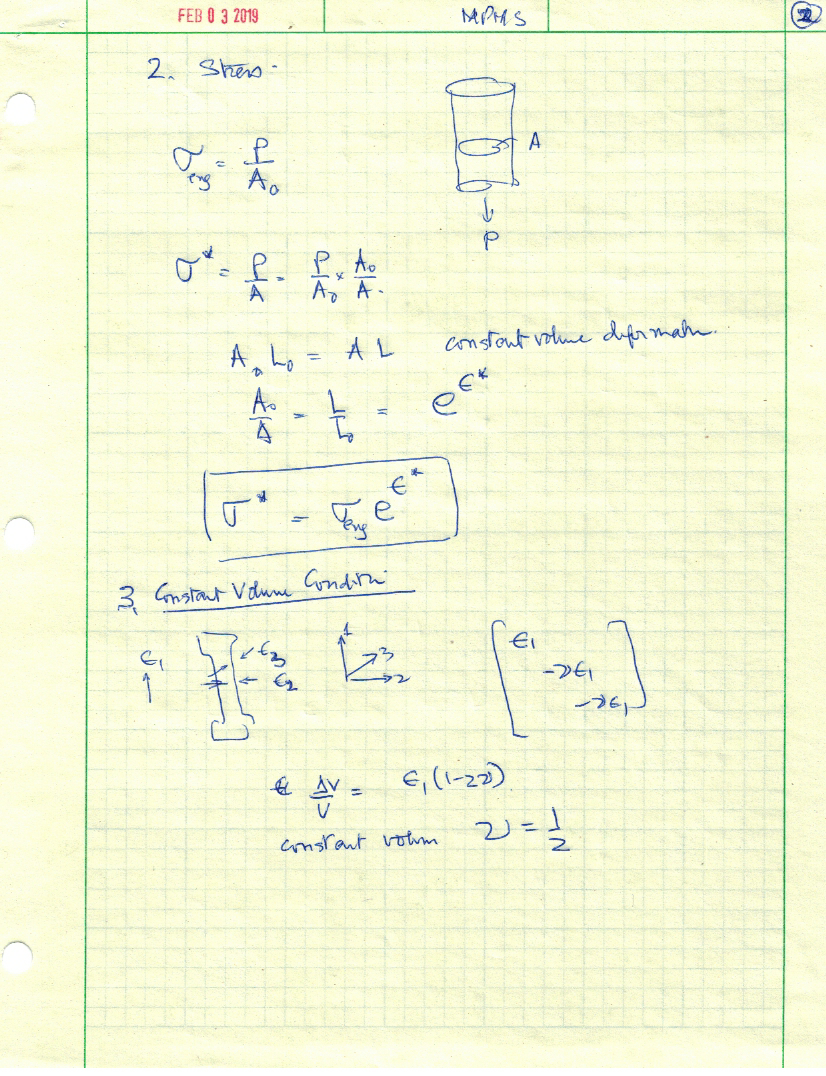
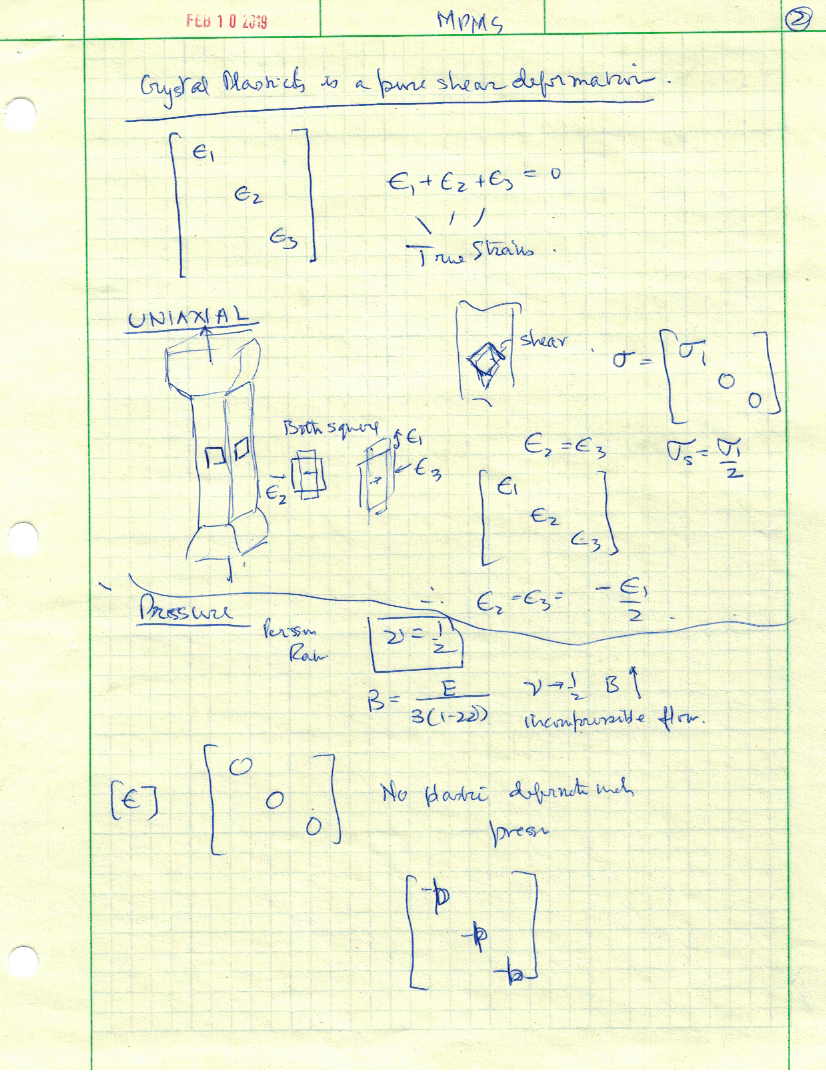
Topic II - Plastic Deformation
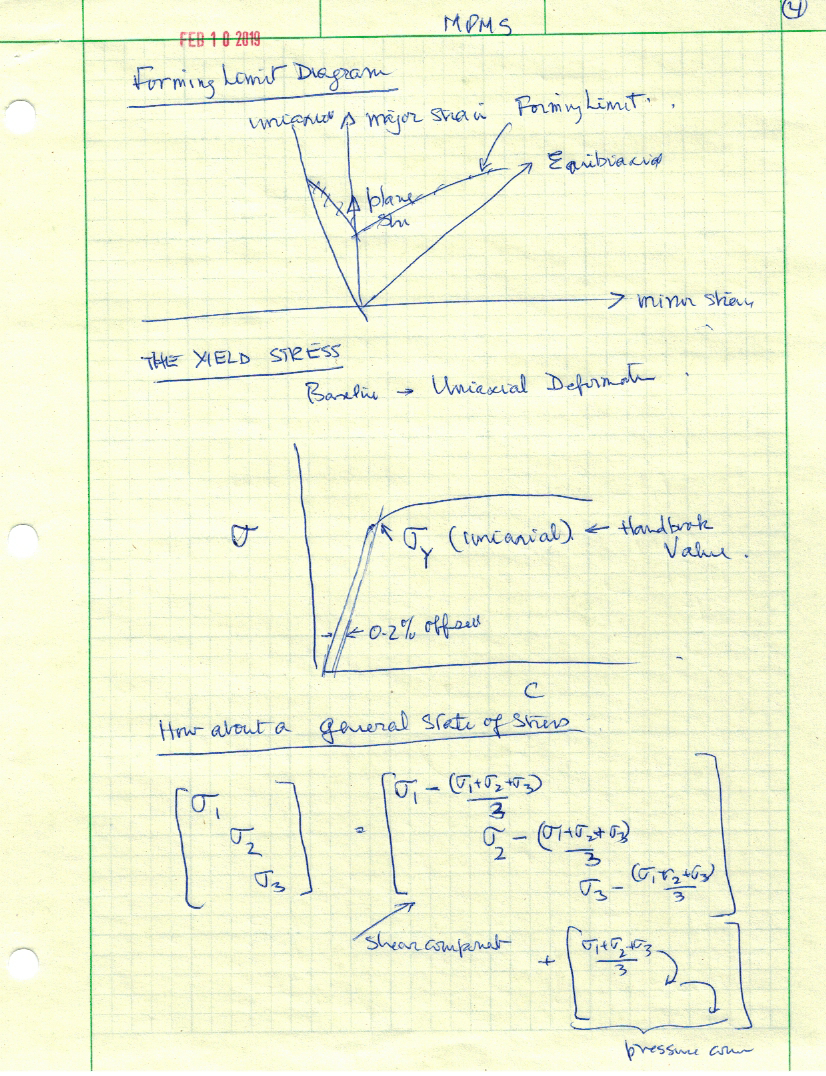
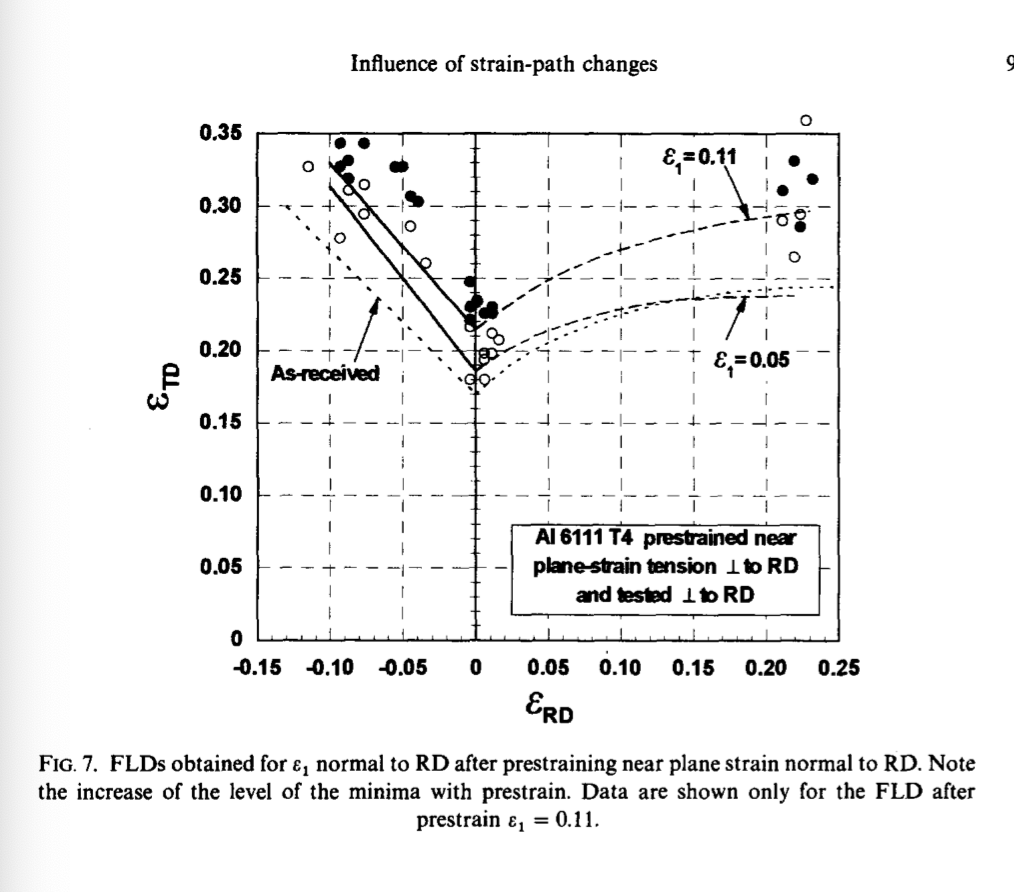
Forming Limit Diagrams
Note the three limiting strain paths: equibiaxial, plane-strain and uniaxial. The forming limit is the point of fracture which depends on the state of stress, with the plane strain having the lowest strain to fracture
 TOP
TOP
Zinc
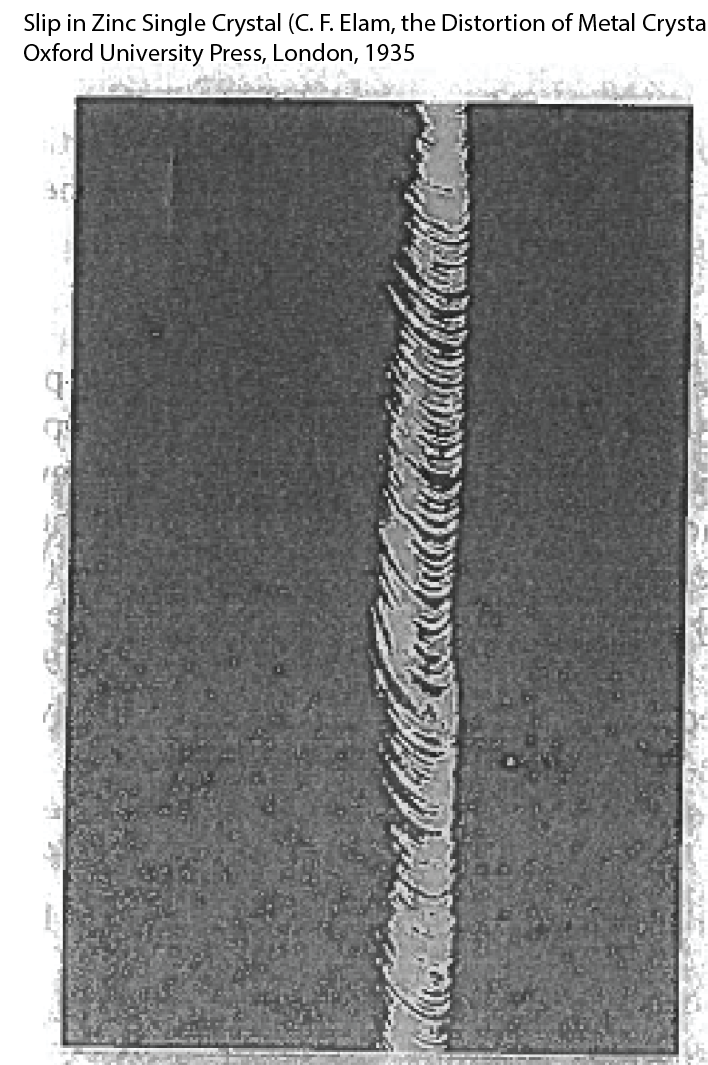
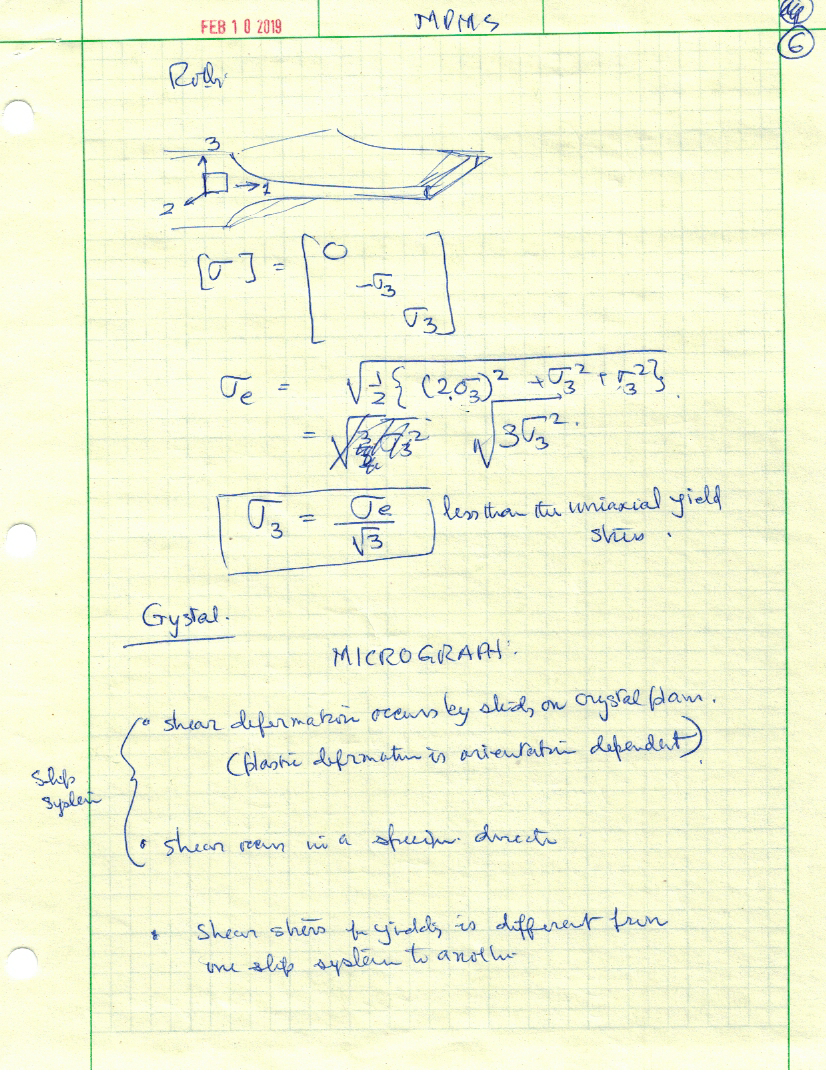
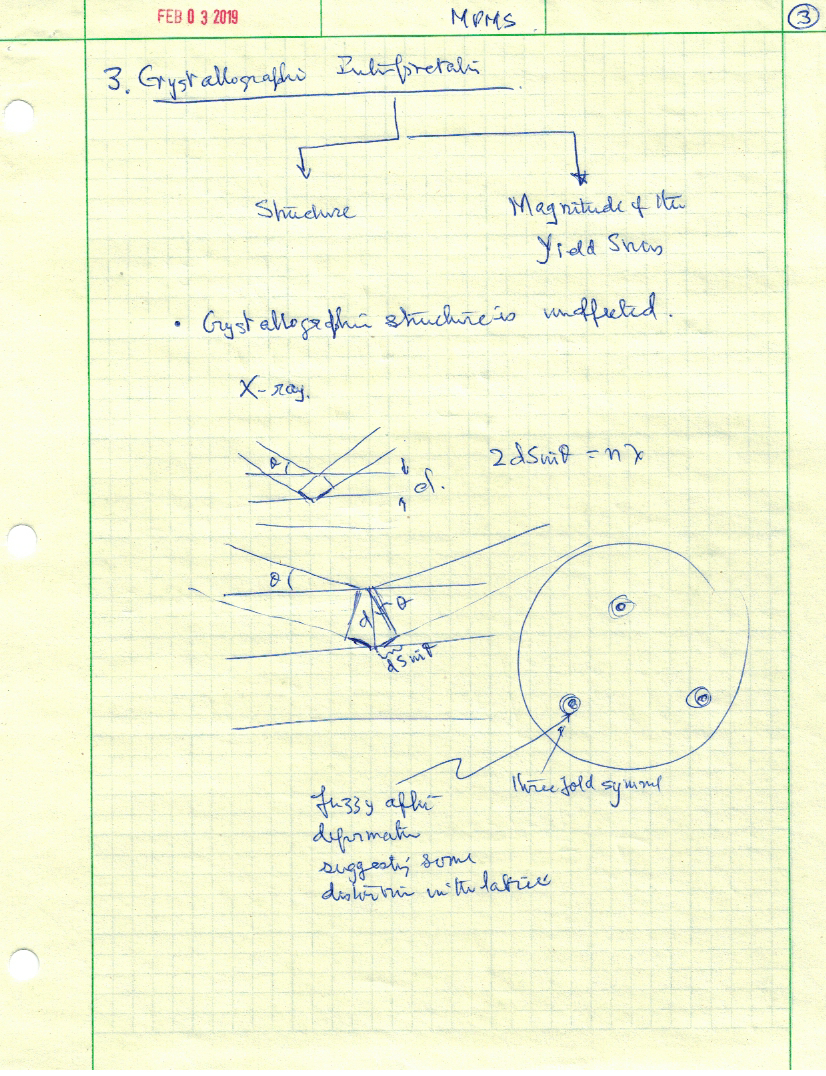
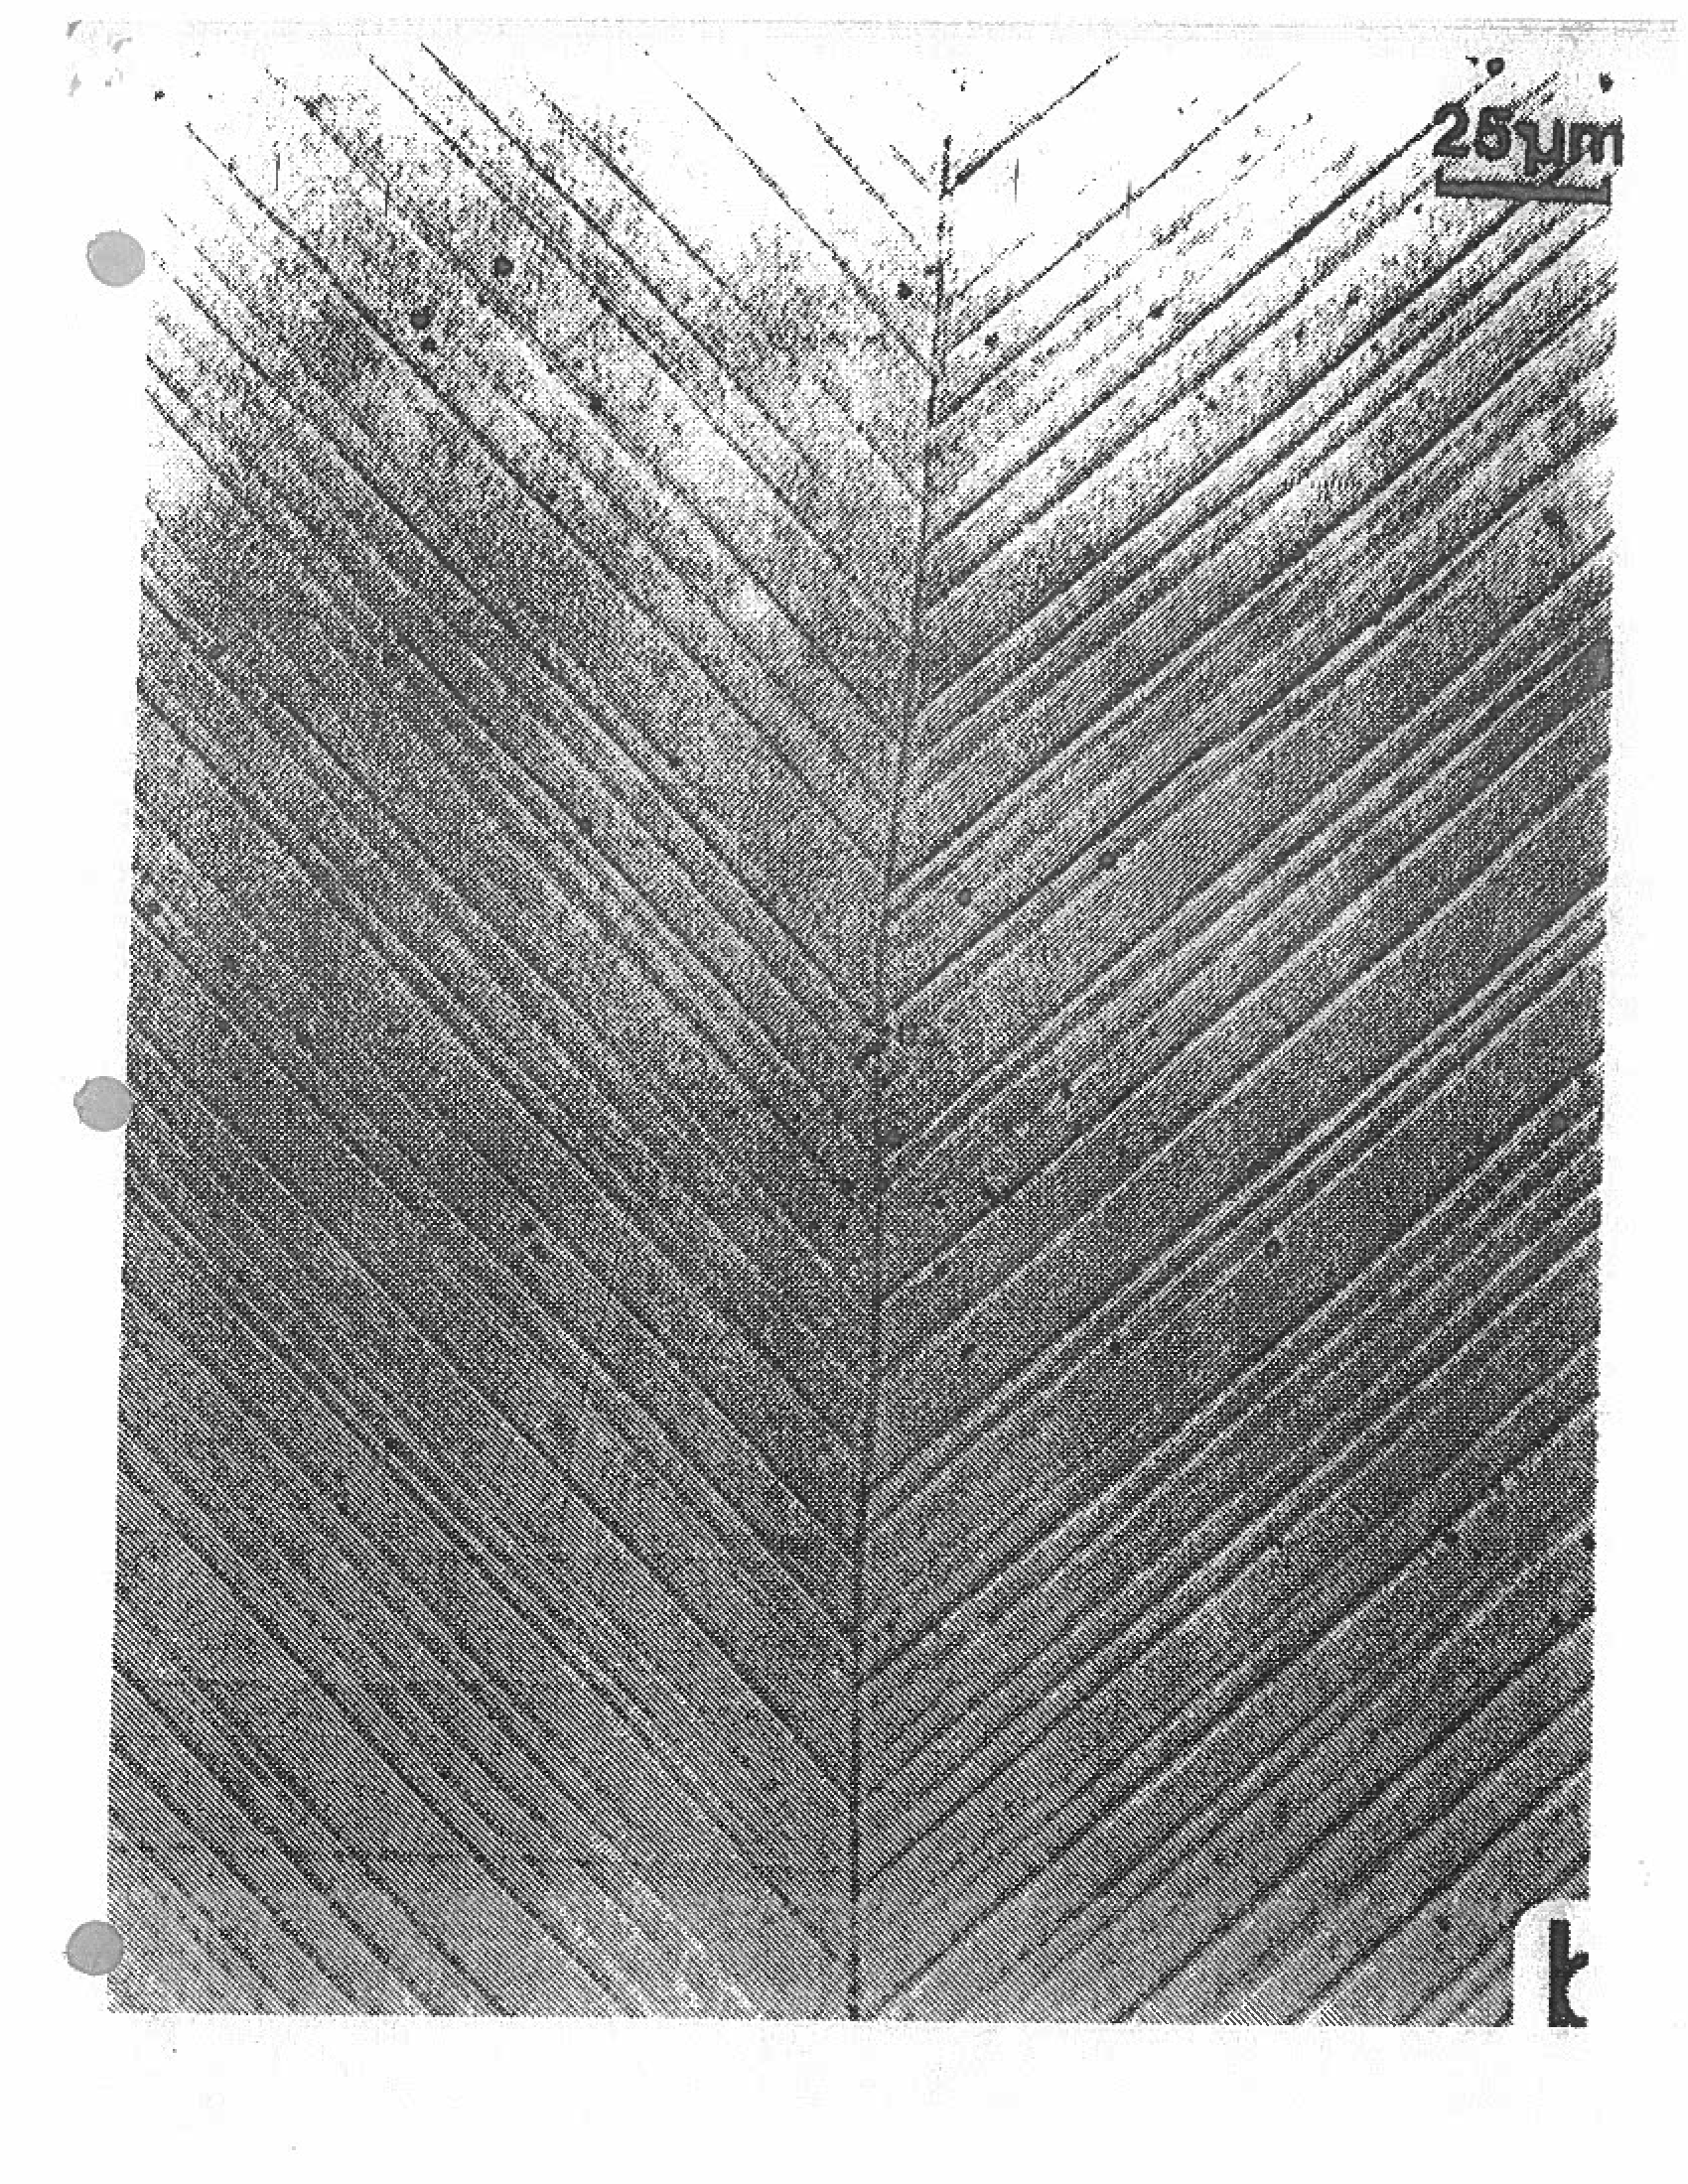
On the left is a picture of cylindrical single crystal of zinc which is pulled uniaxially.
It has the following notable features:
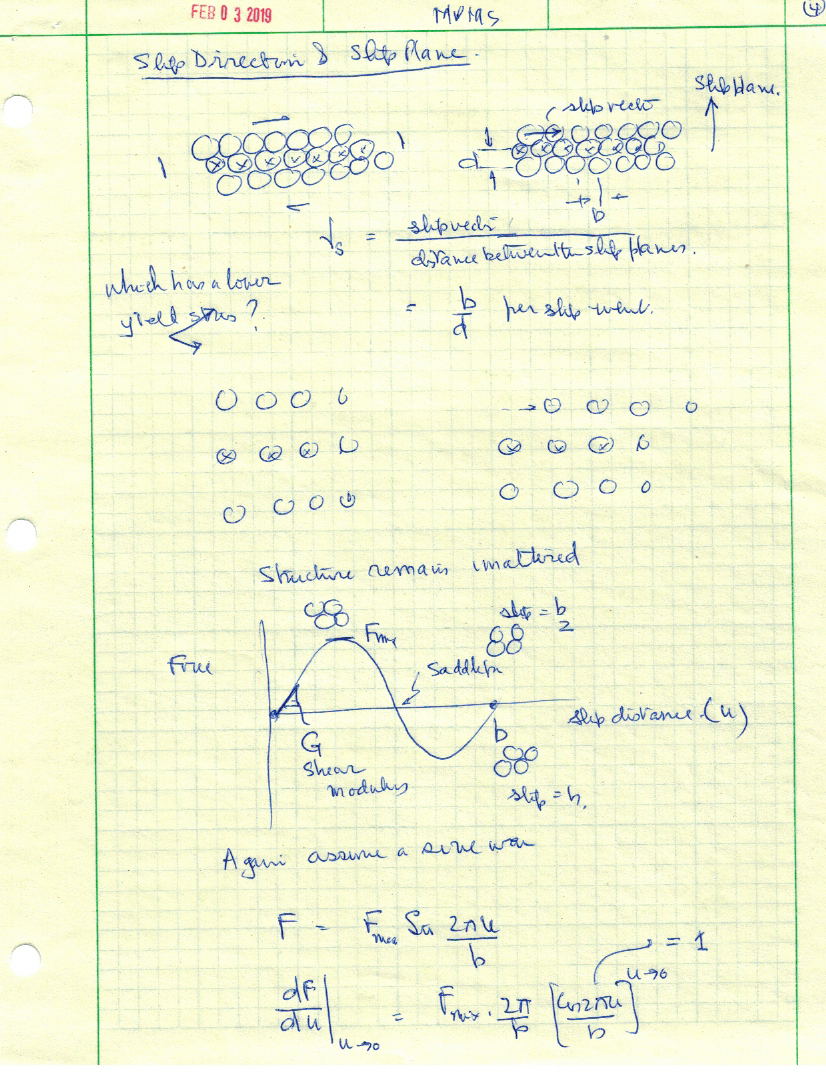
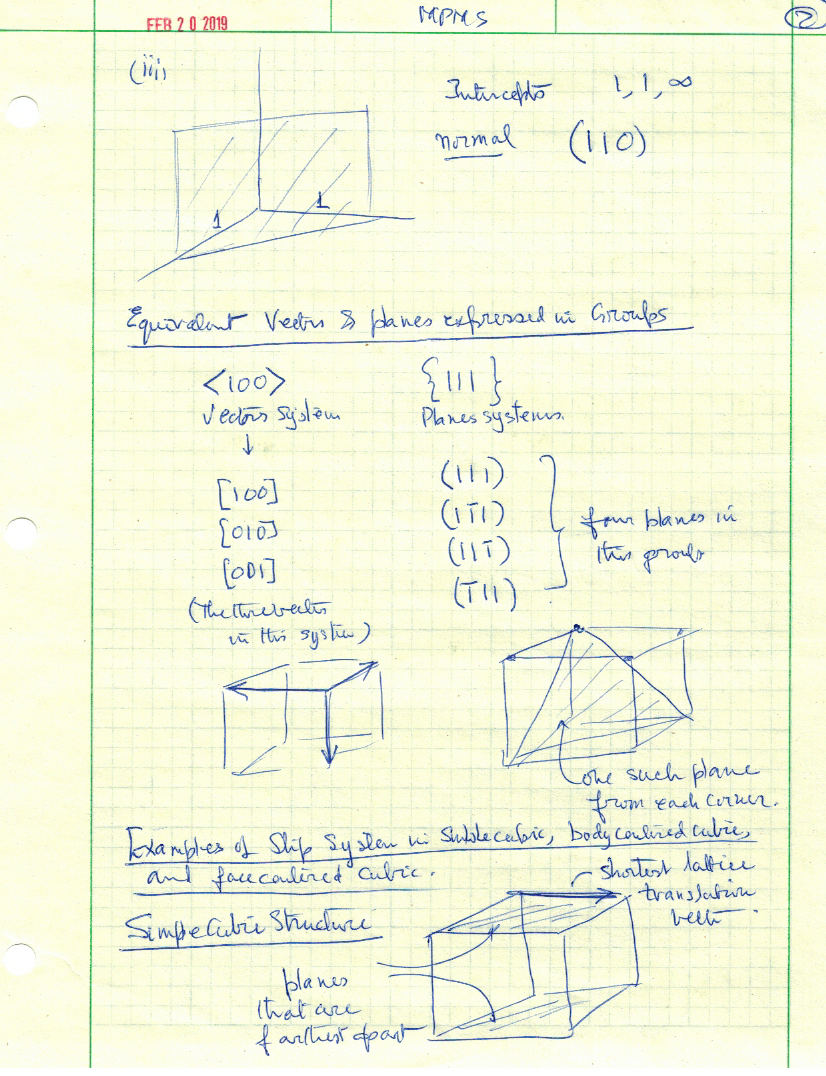
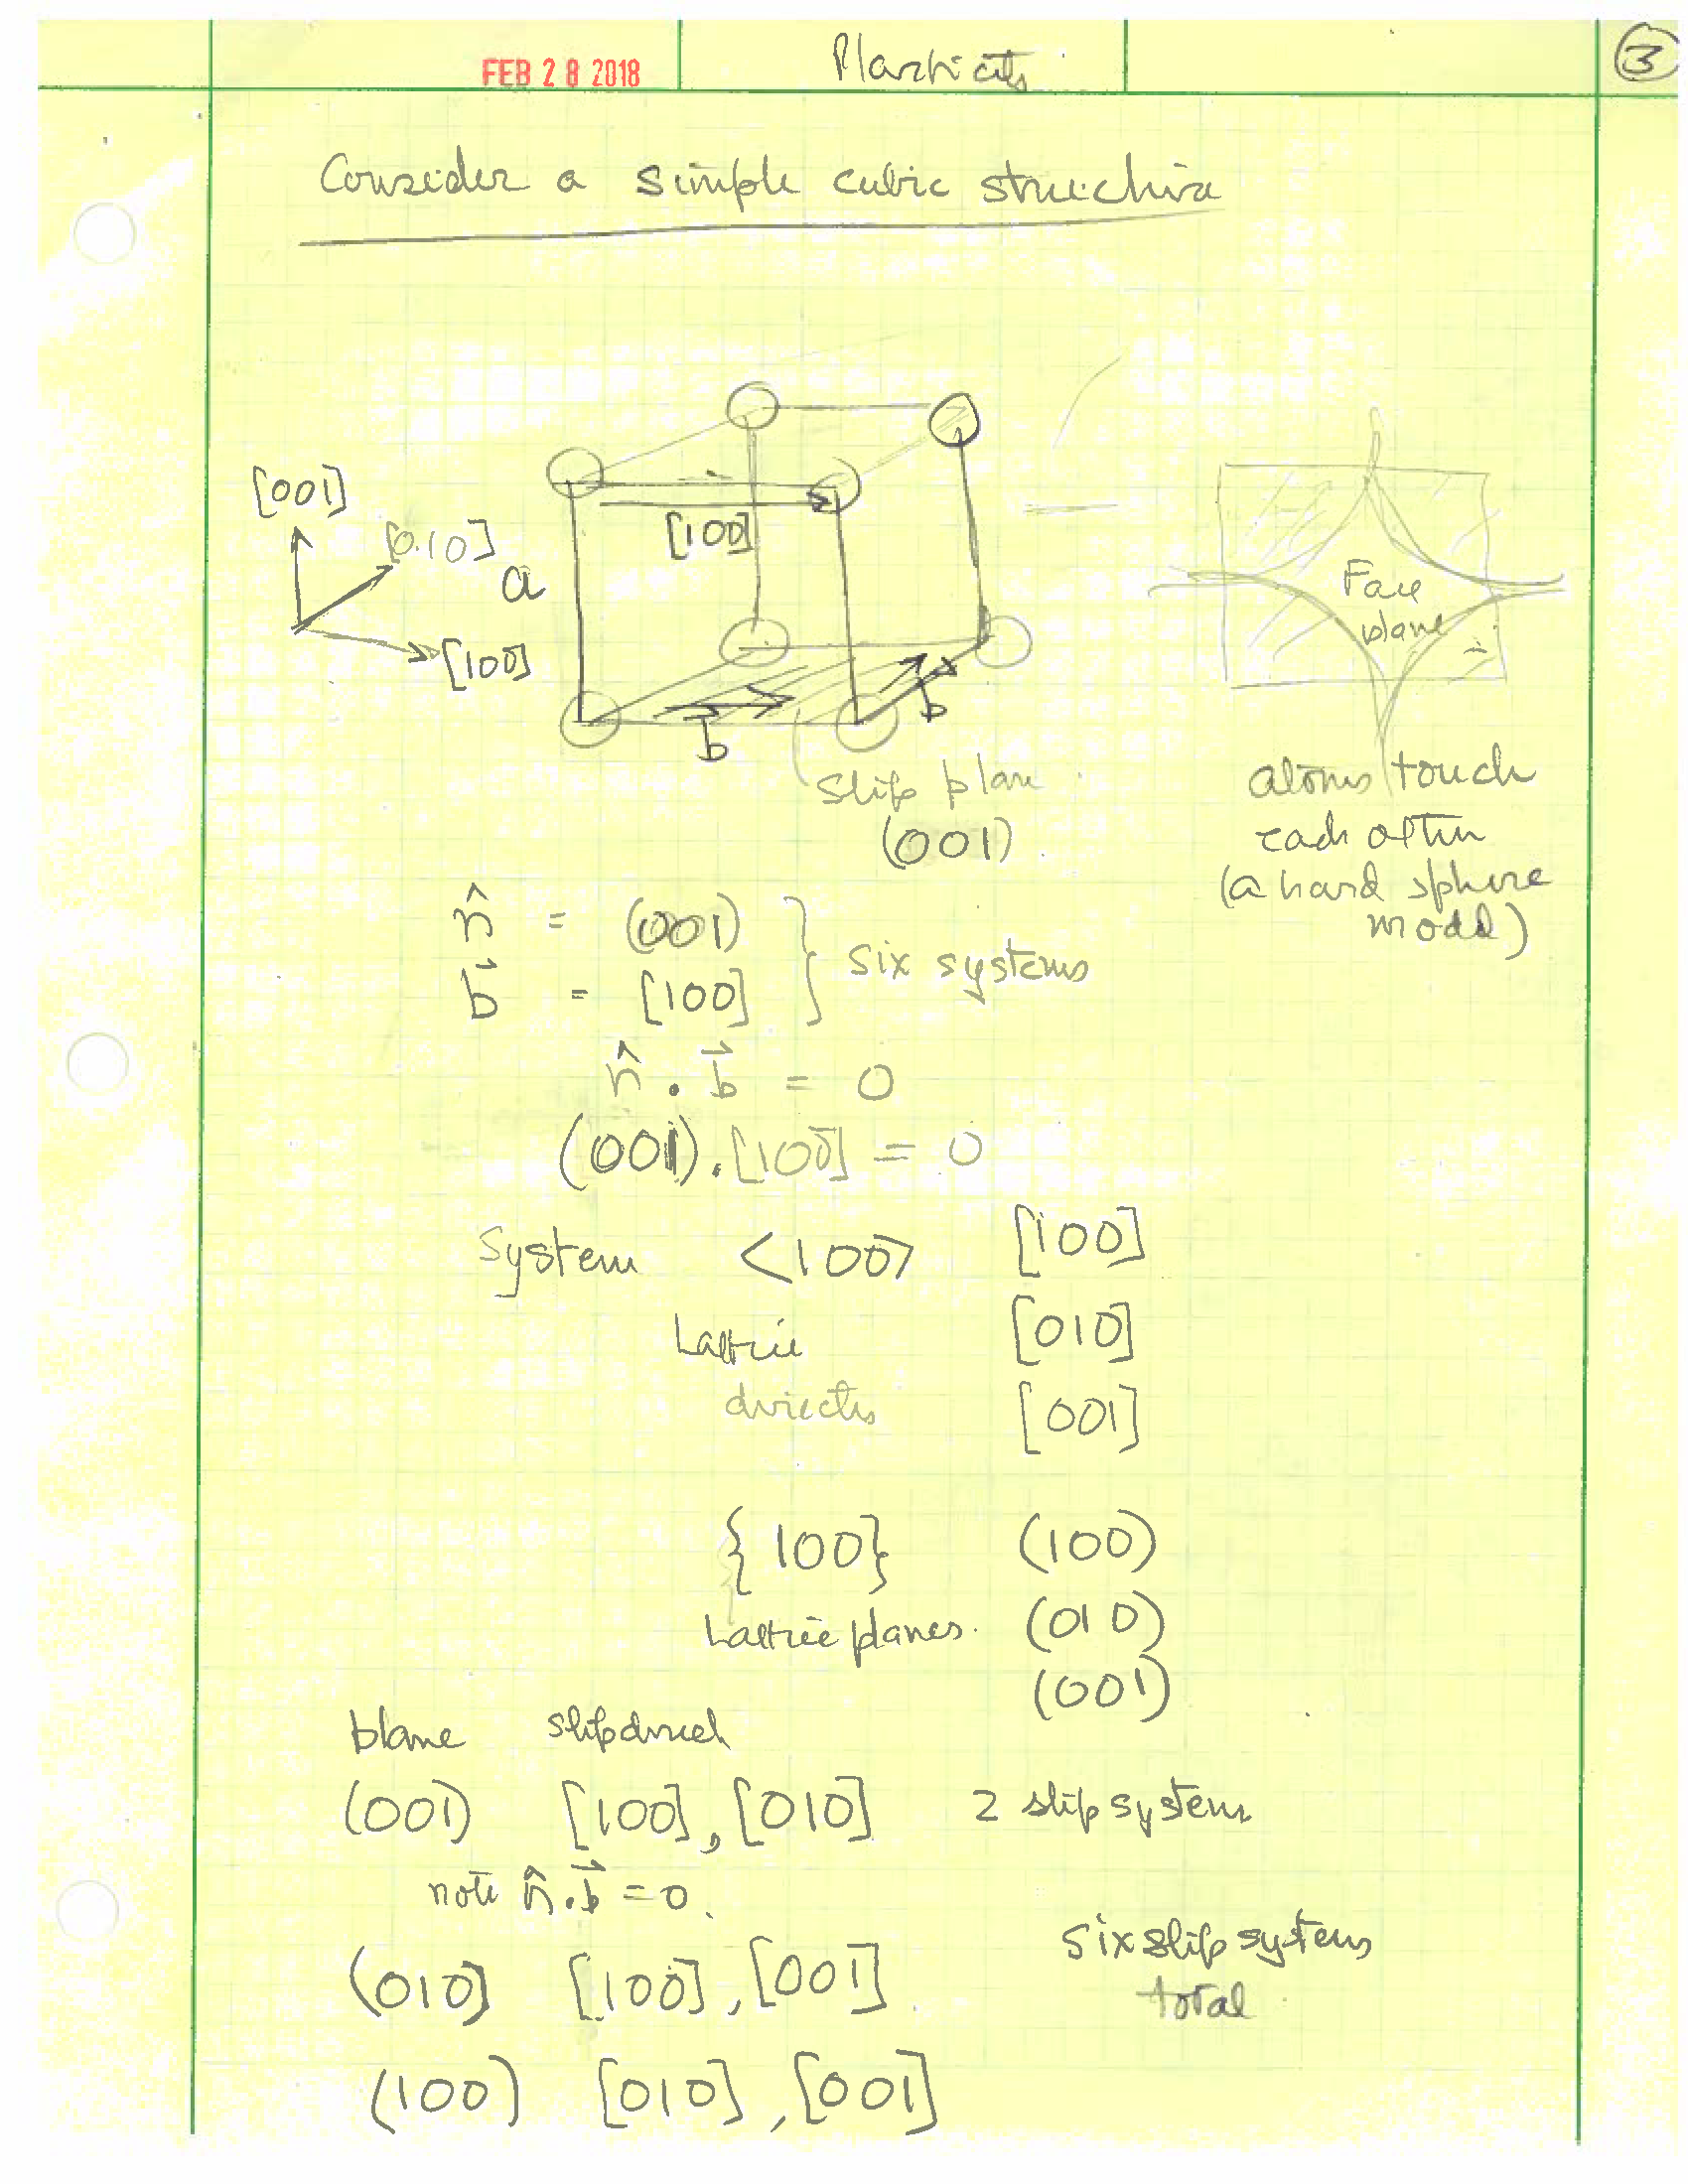
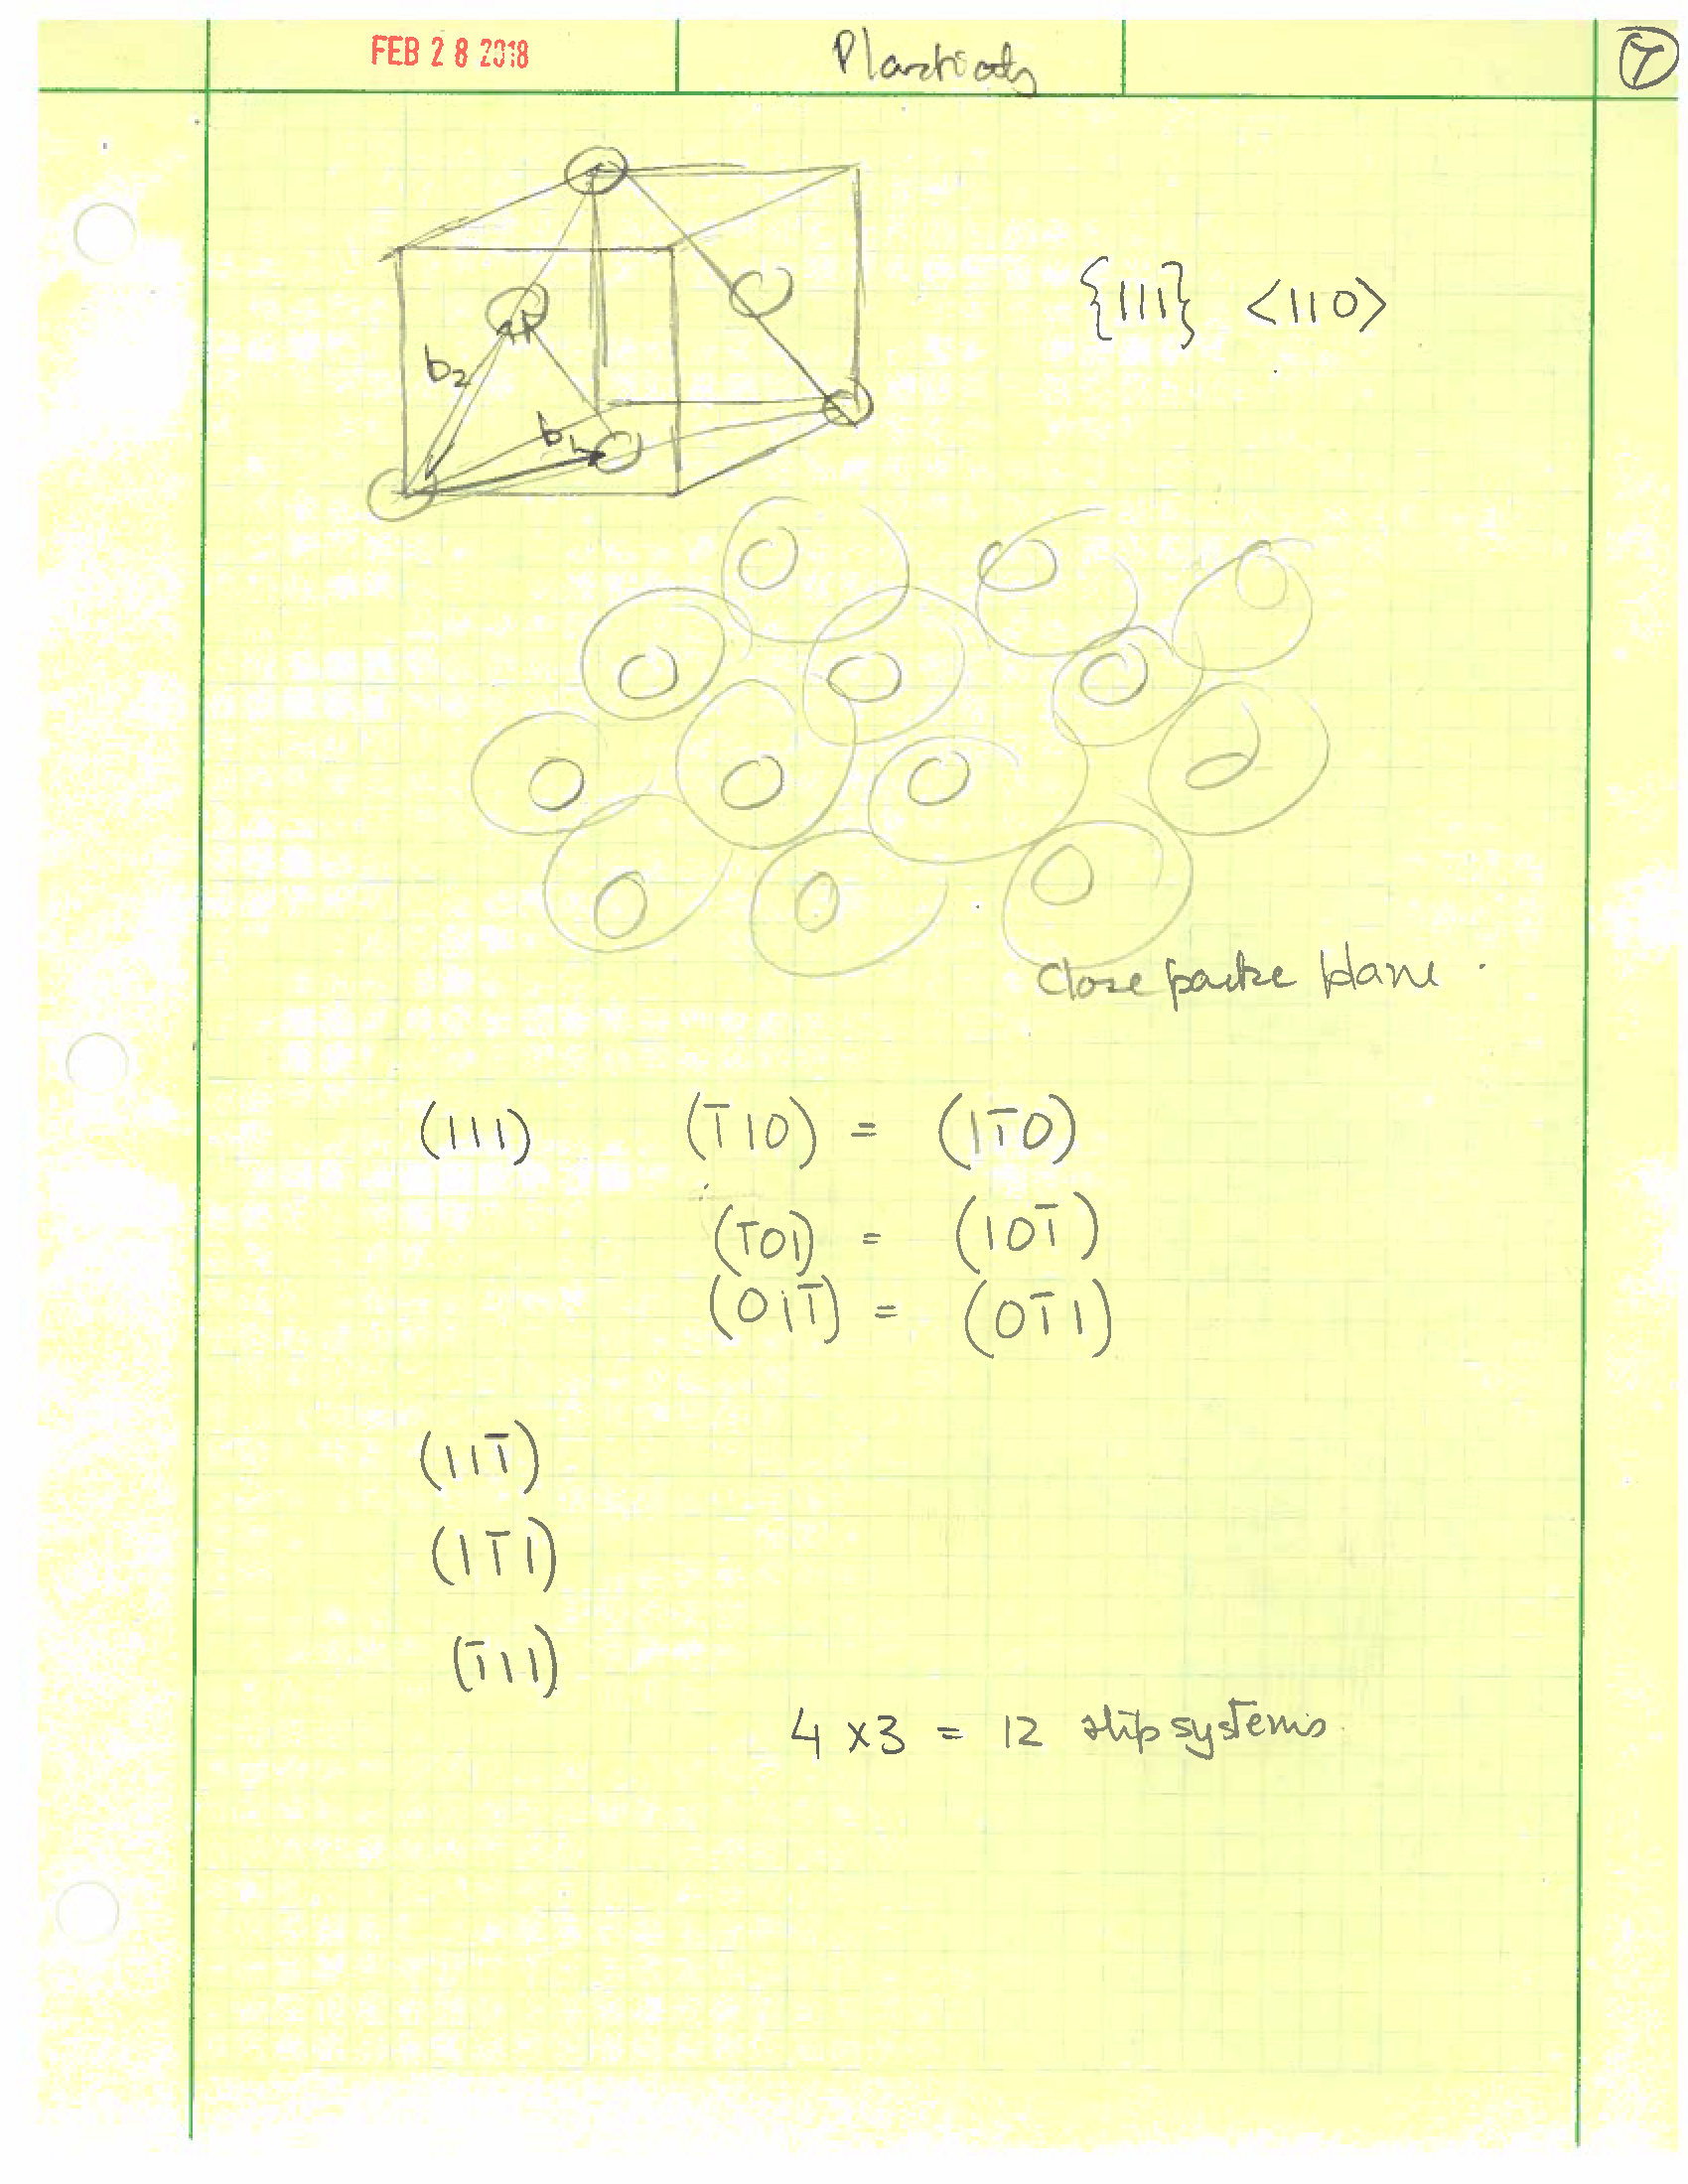
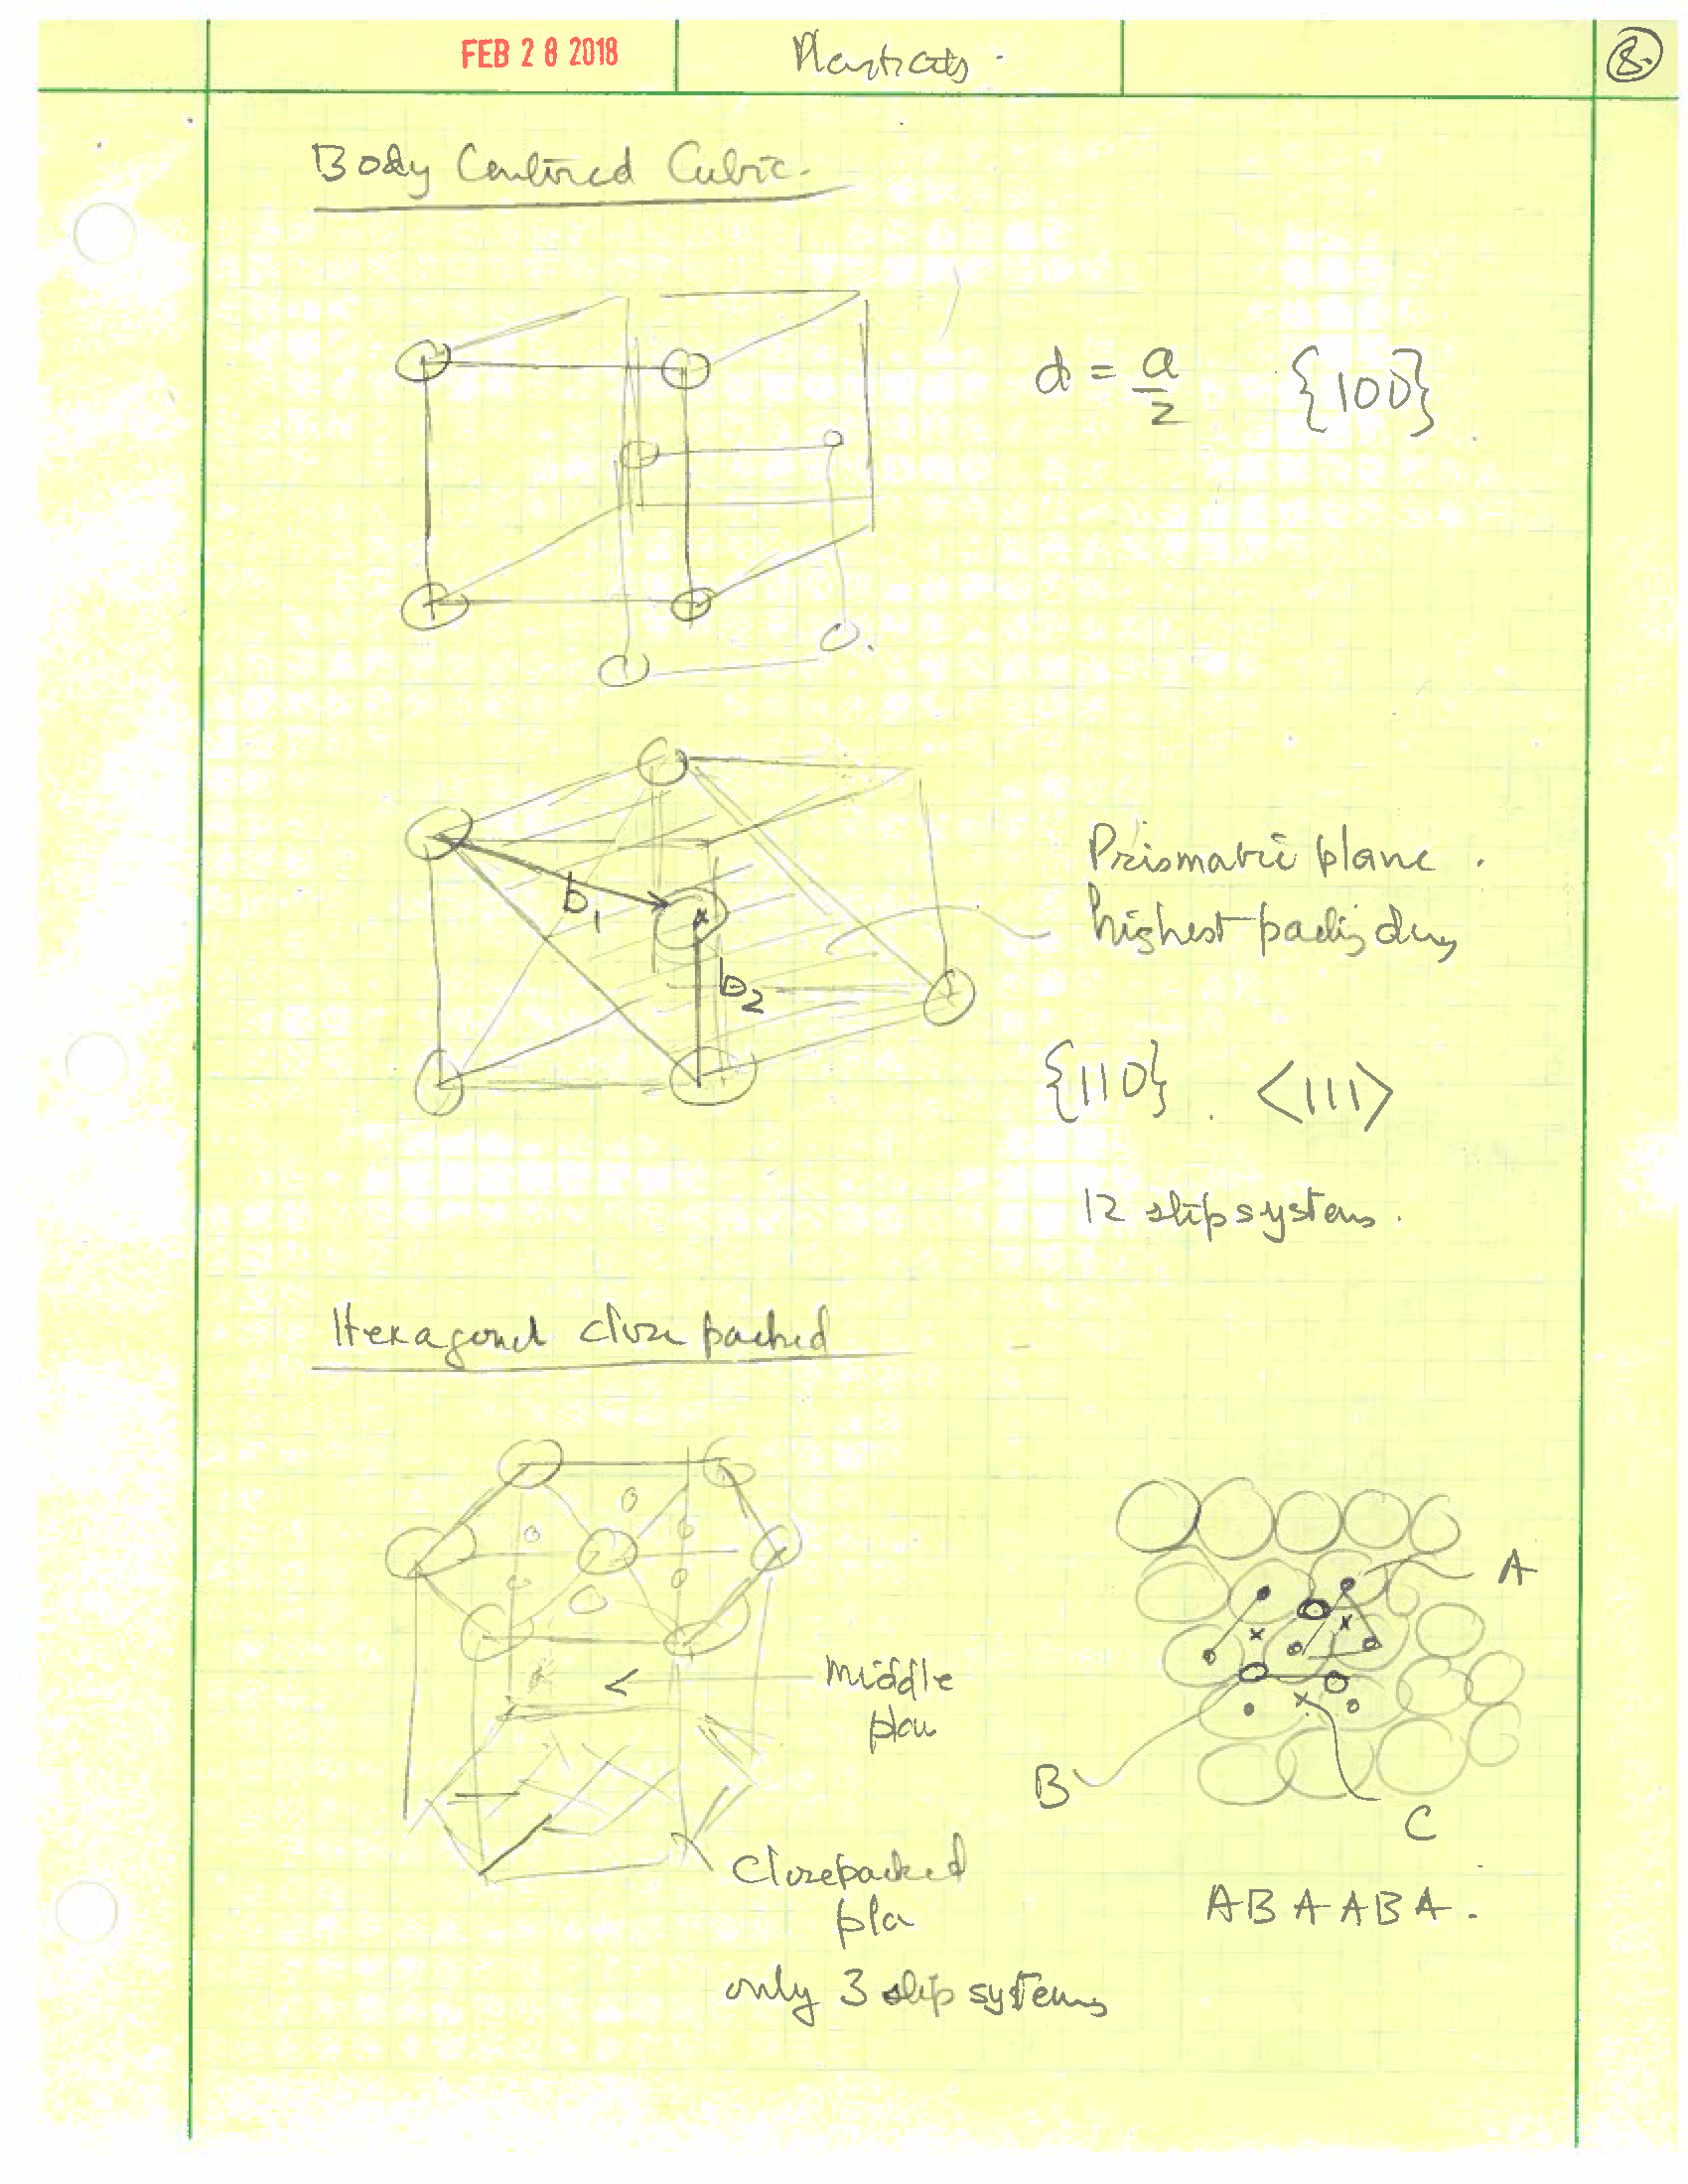
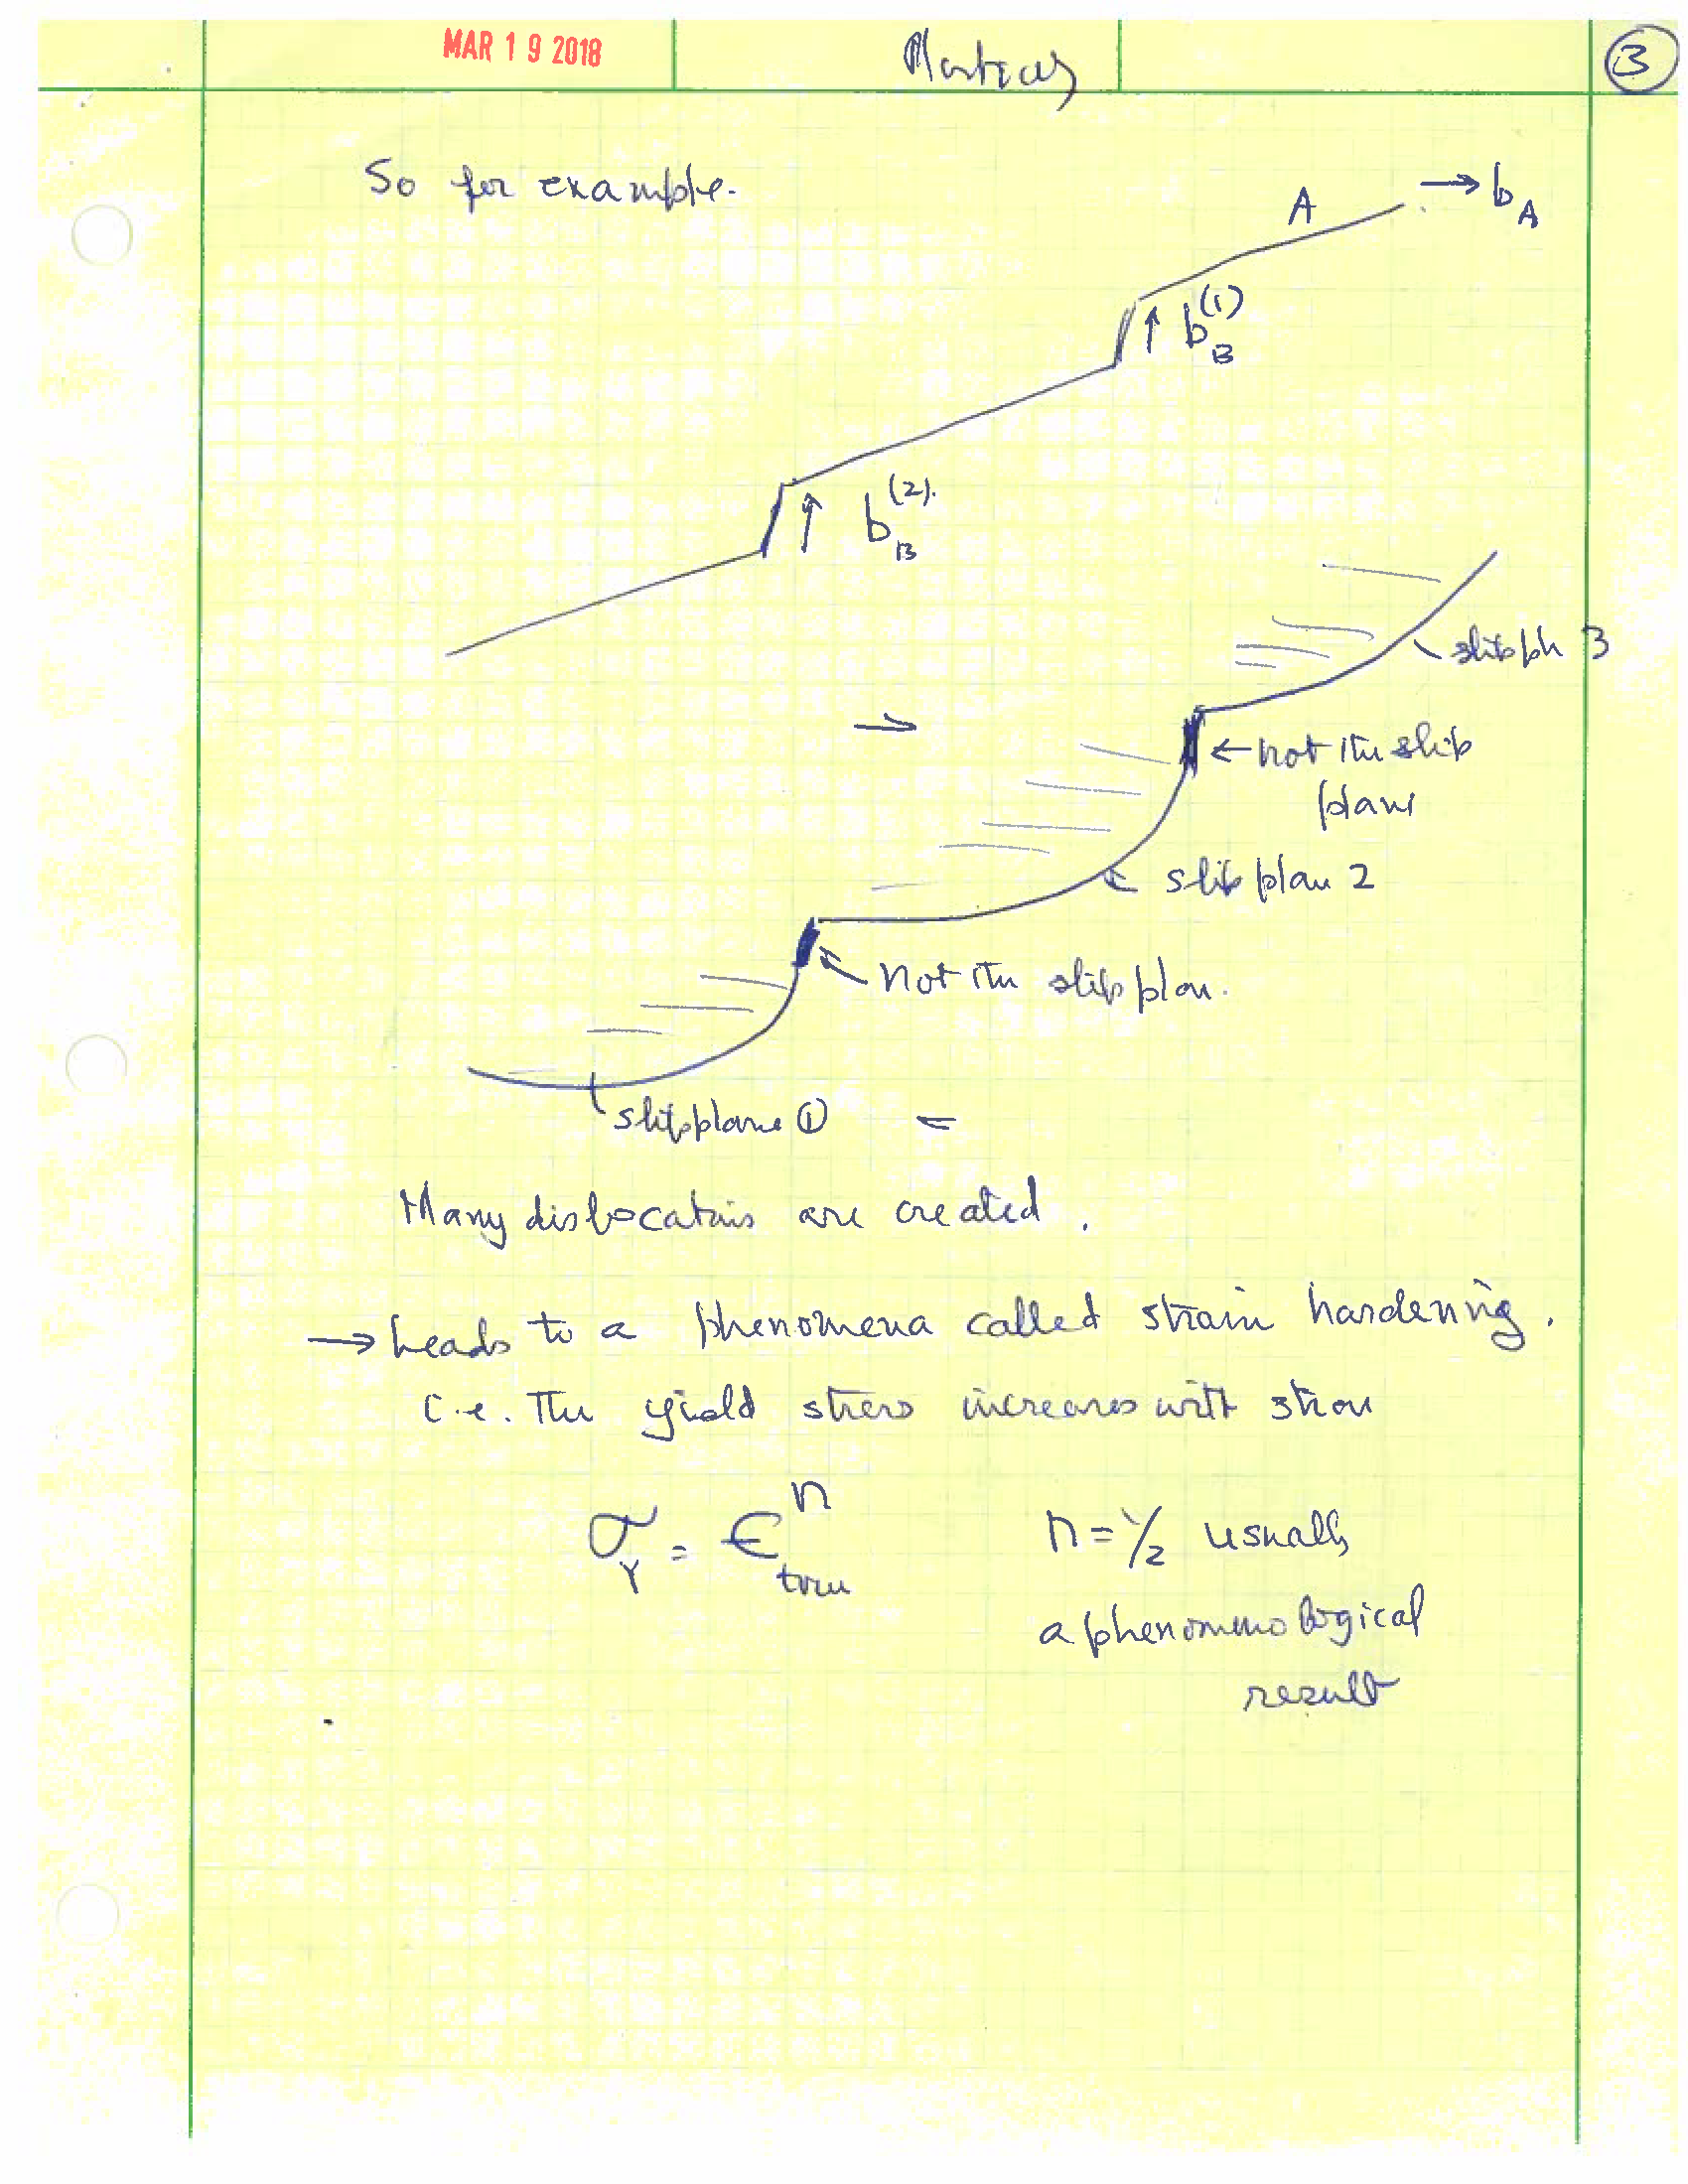
(i) Plastic deformation is accommodated by sliding on crystal planes, without changing the crystal structure,
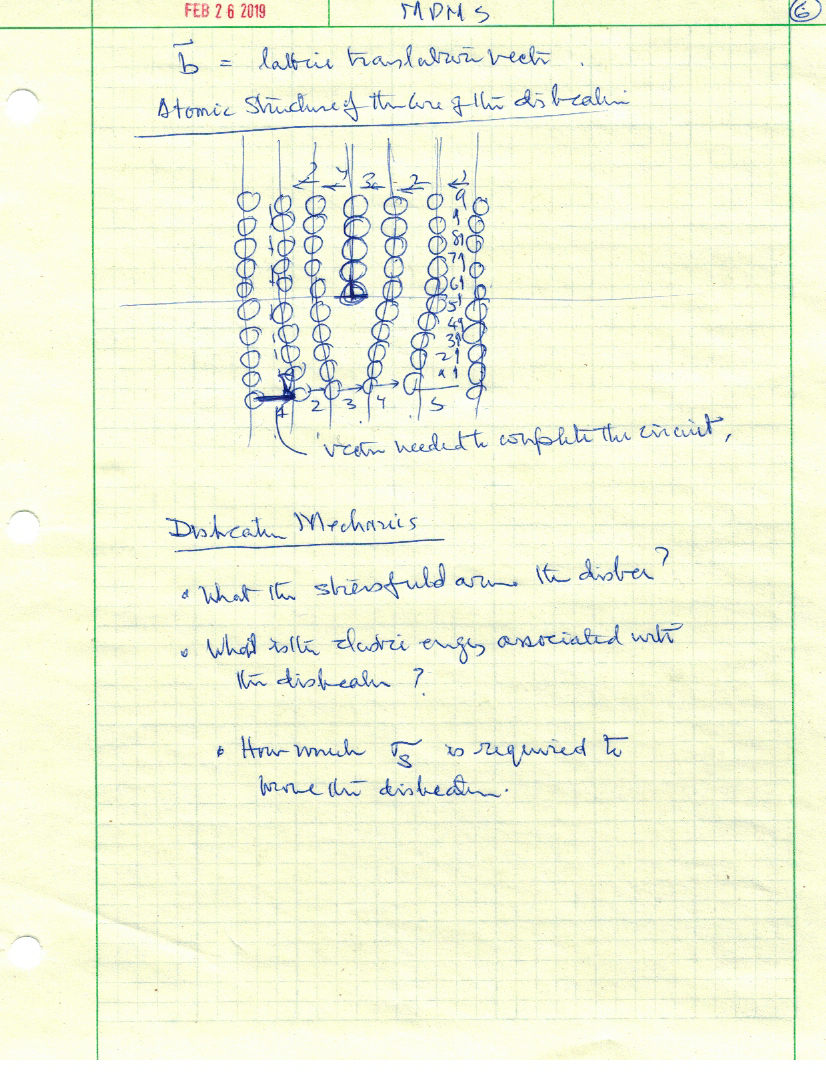
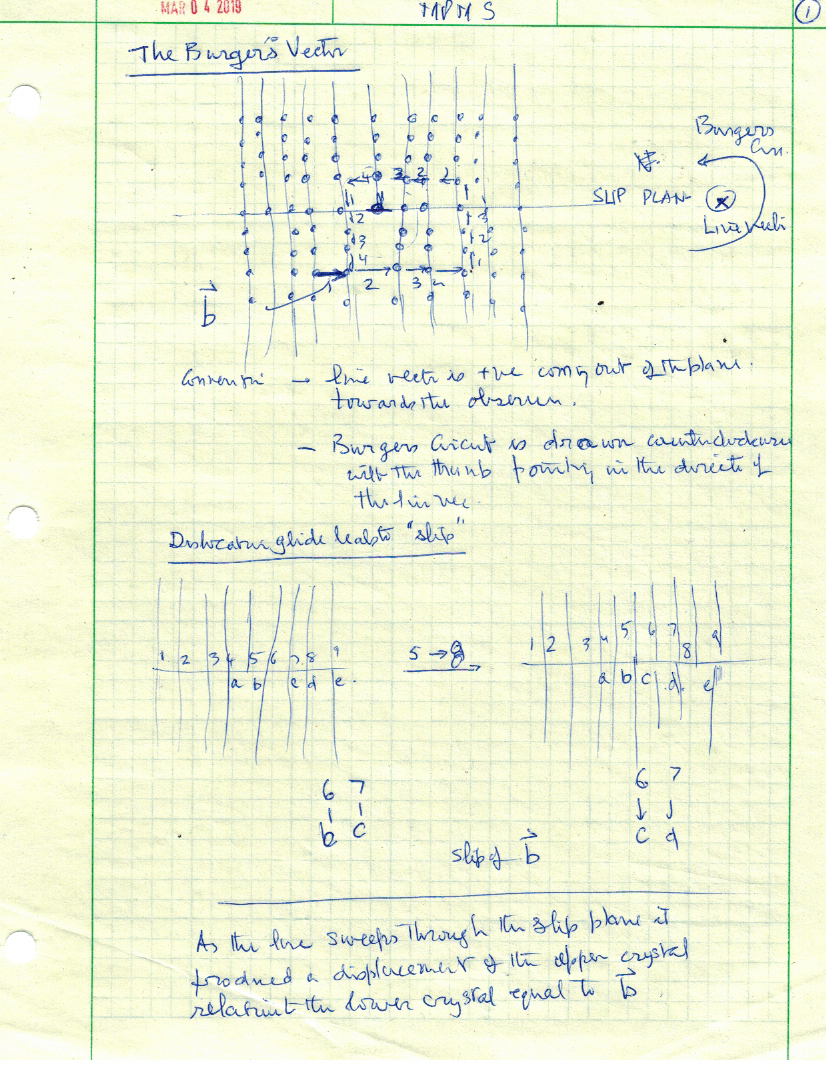
(ii) What is not immediately evident is the the direction of slip is also specific to a specific lattice translation vector,
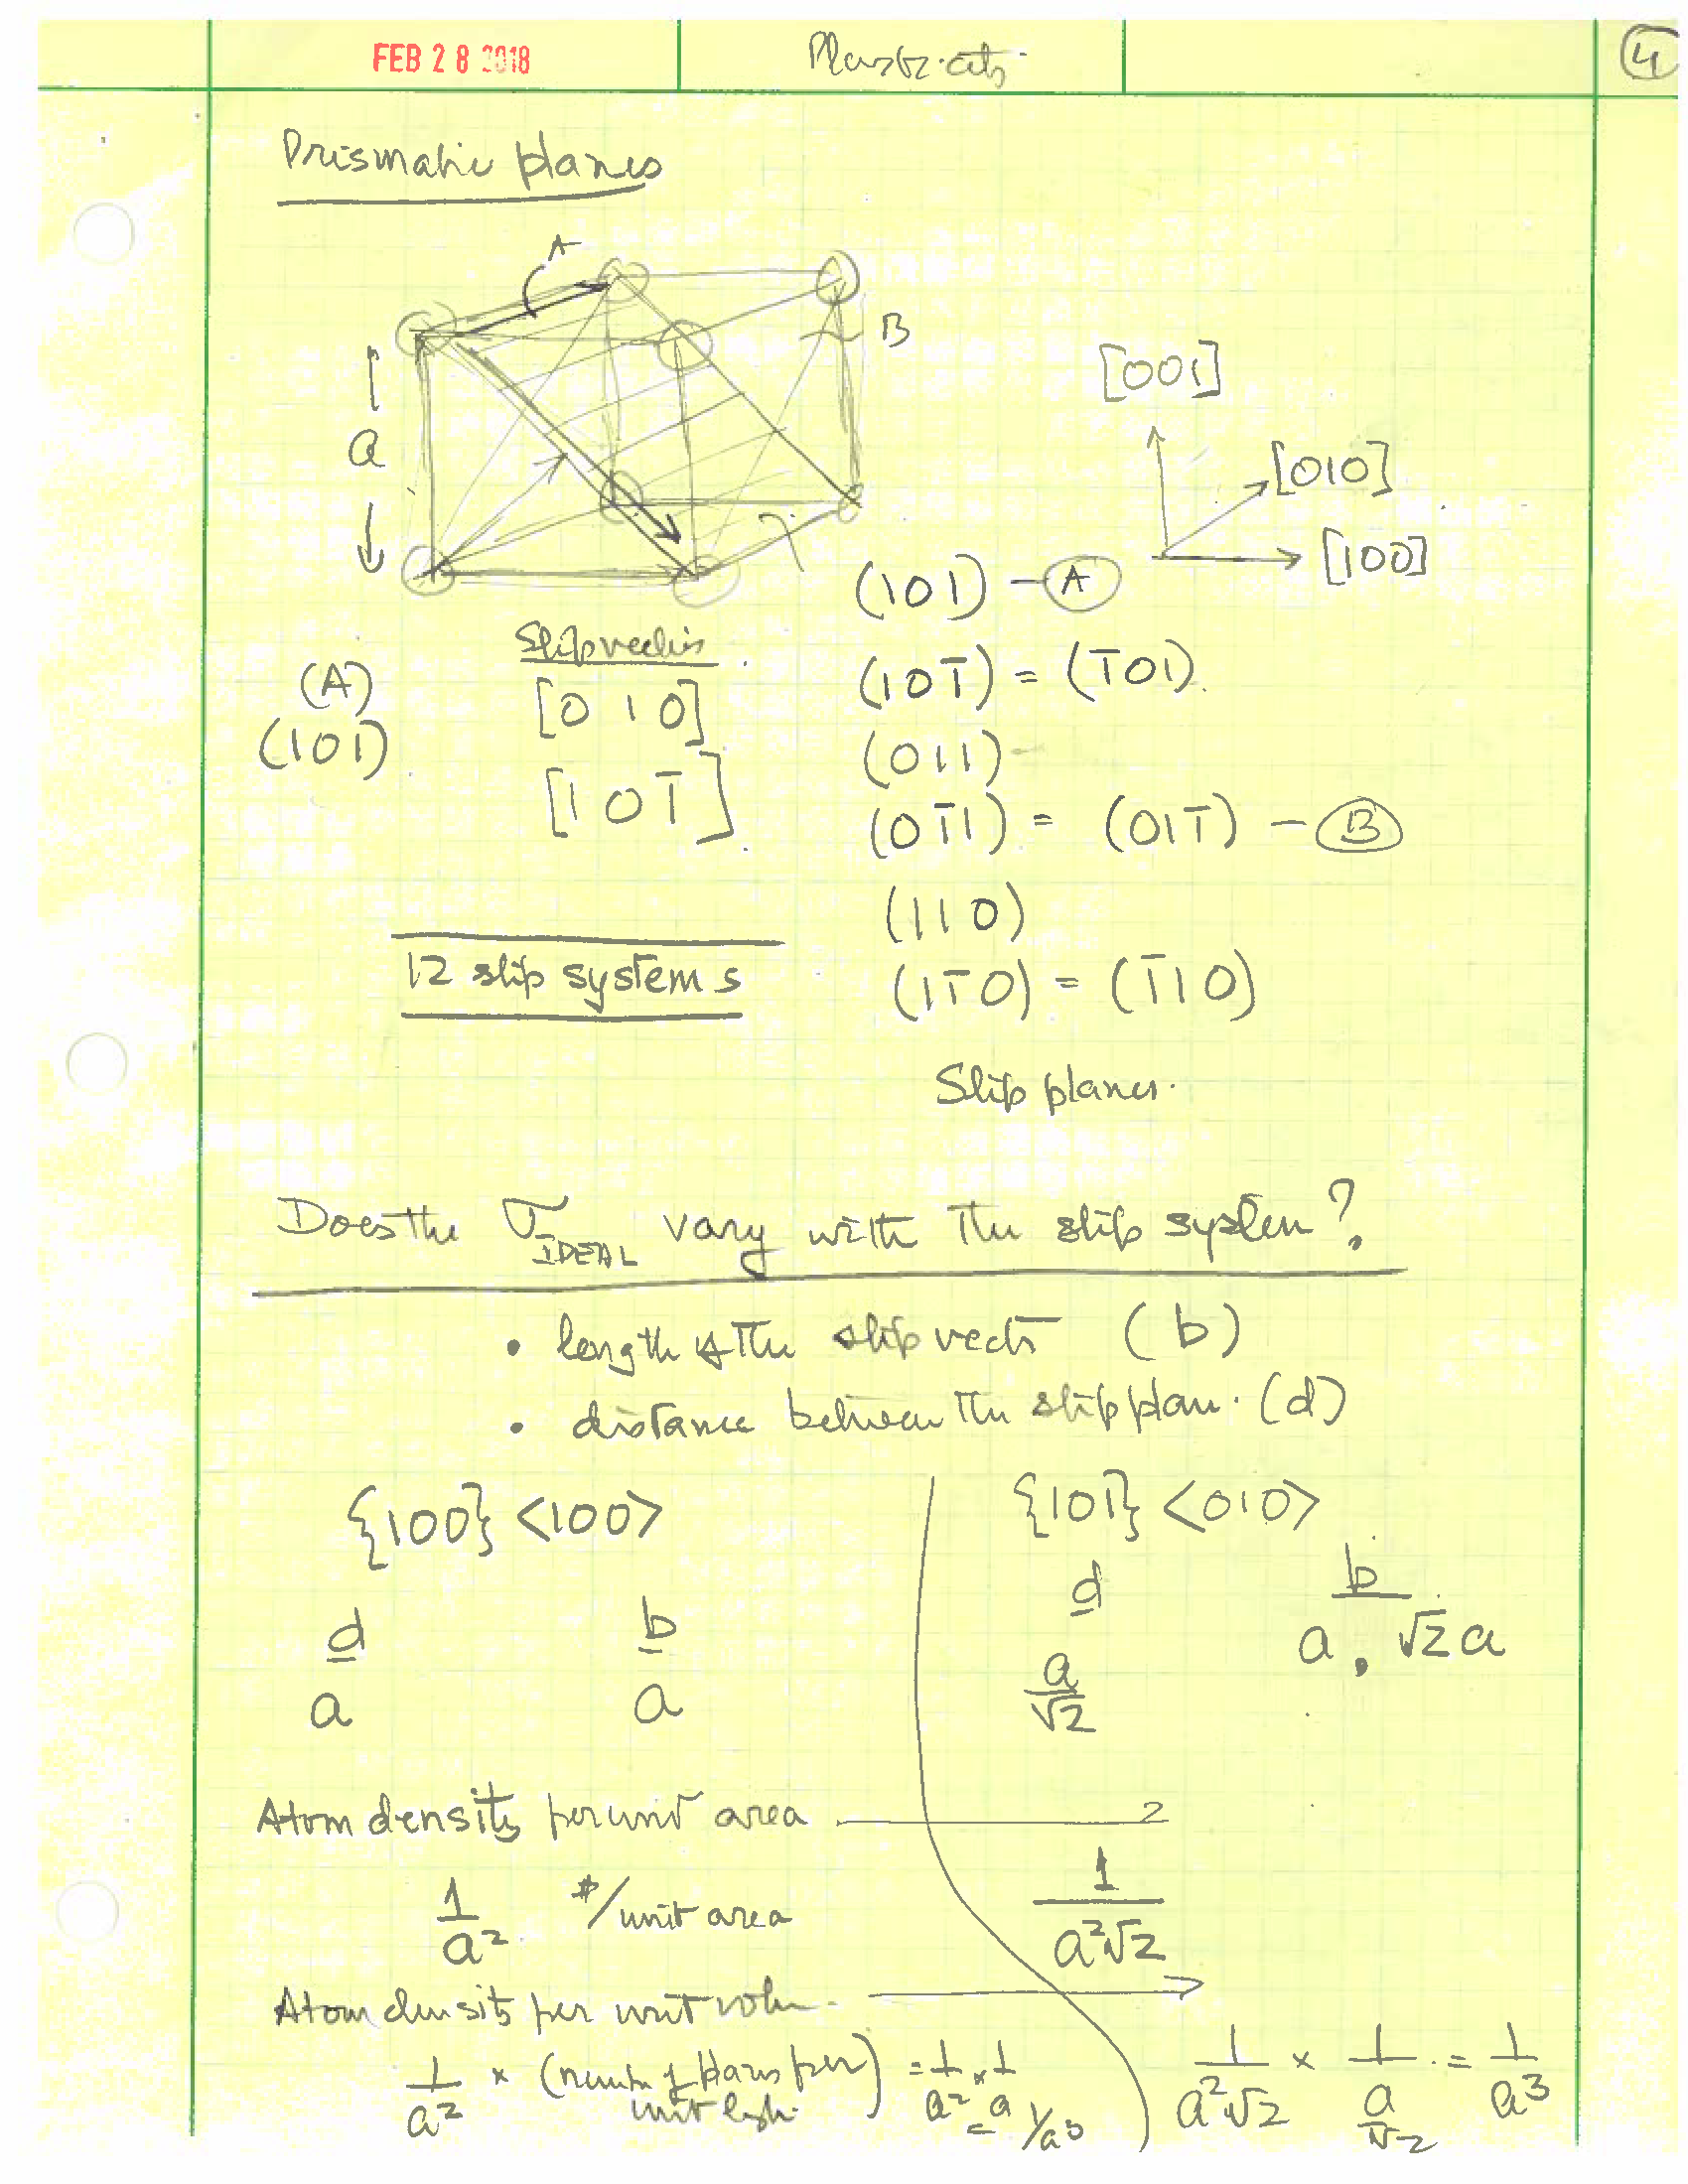
(iii) The distance between the slip planes is much greater than the atomic spacing of the planes in teh crystal; the latter is sub-nanometer where as the "slab thickness" is several micrometers, (iv) the slip distance can be translated into uniaxial elongation from geometry.
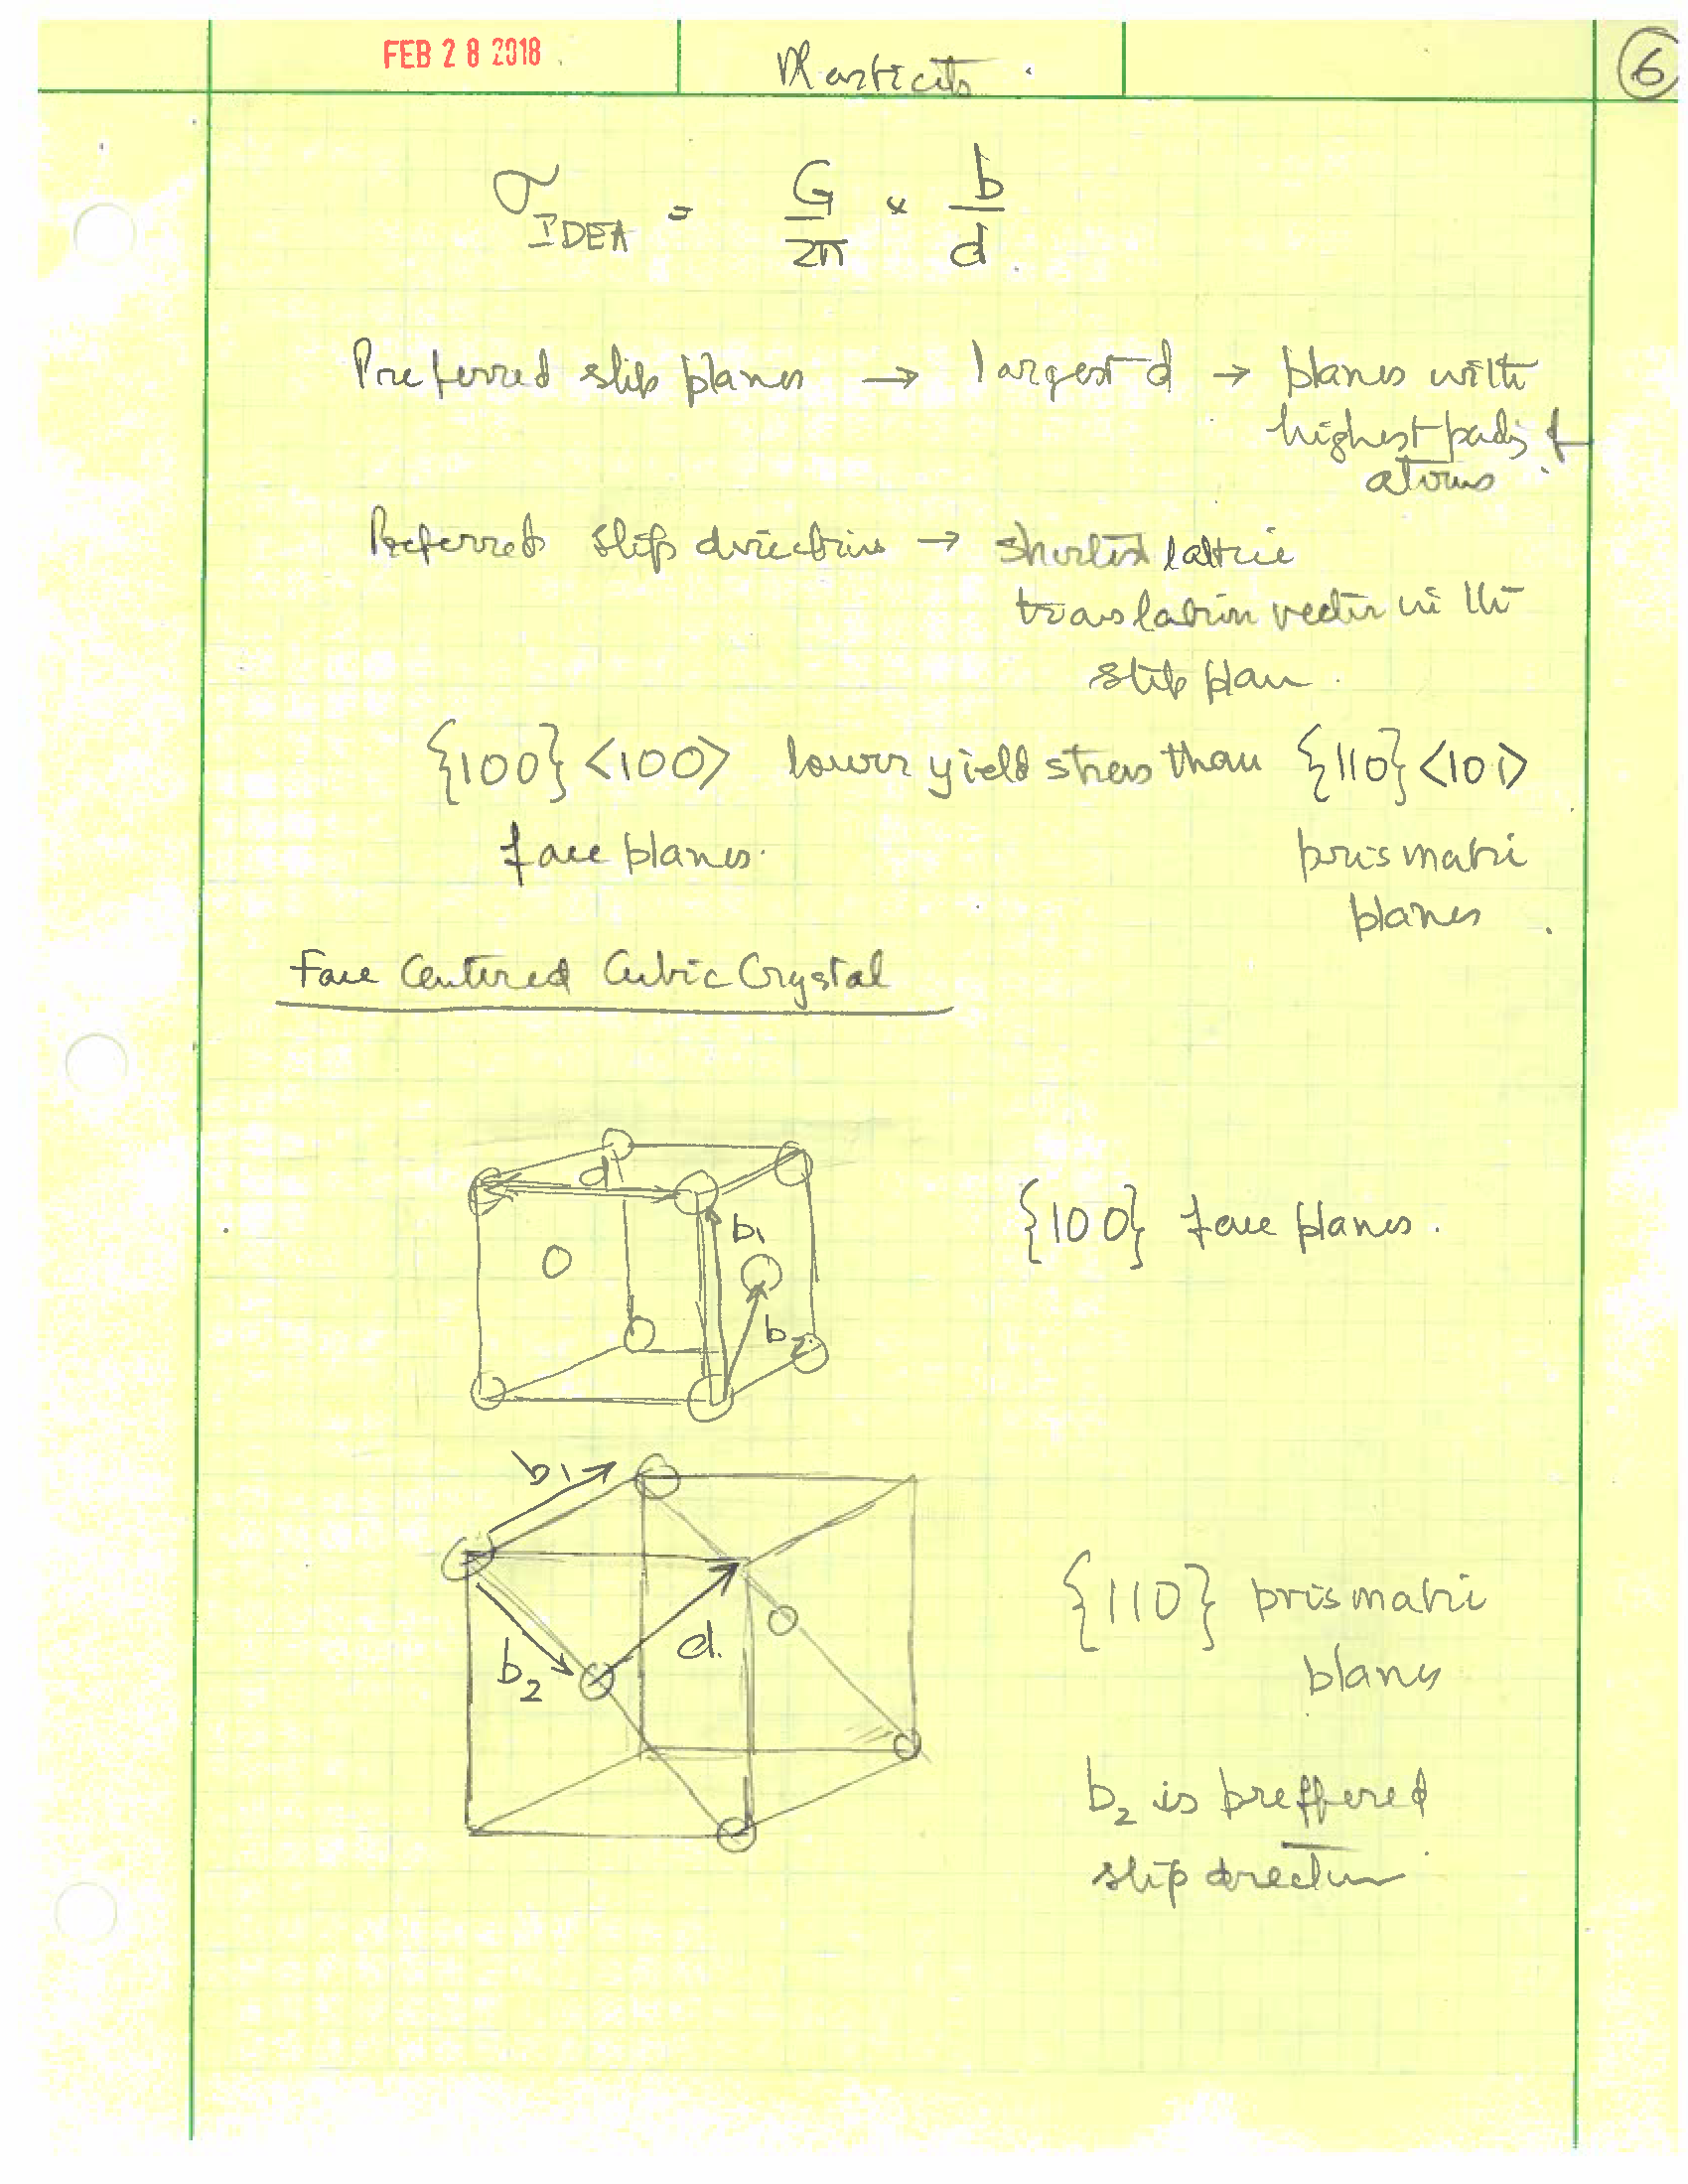
An interesting point about this micrograph is that it is seen only with single crystals. If a polycrystal of zinc is deformed it falls to pieces as if it is brittle. As seen later this happens because of paucity of slip systems in the crystal structure of zinc
TOP
Critical Resolved Shear Stress
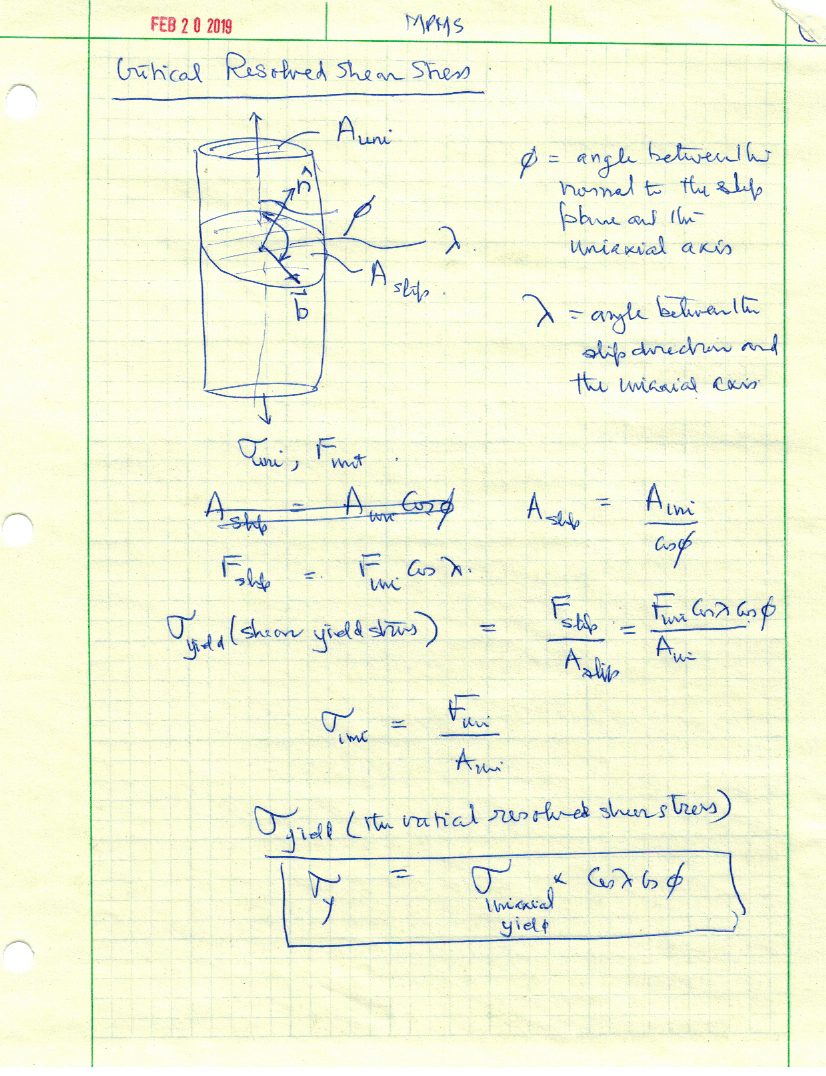
CRSS recognizes that slip occurs on a specific plane and direction that may have any orientation with respect to the uniaxial pulling direction. The material parameter is the yield stress for a specific slip system, however. The analysis below shows how the measured uniaxial yield stress can be related to the "crystallographic" yield stress. It is related to the orientation of the slip plane and the slip direction with respect to the uniaxial direction
TOP
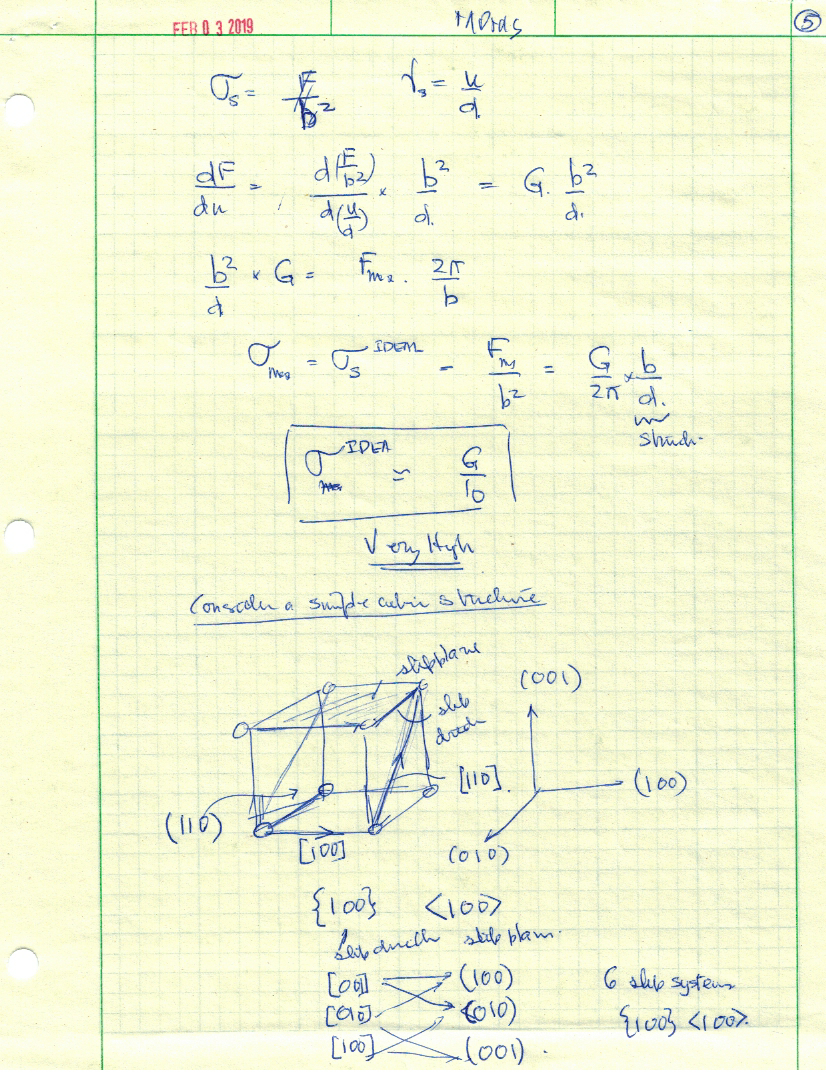
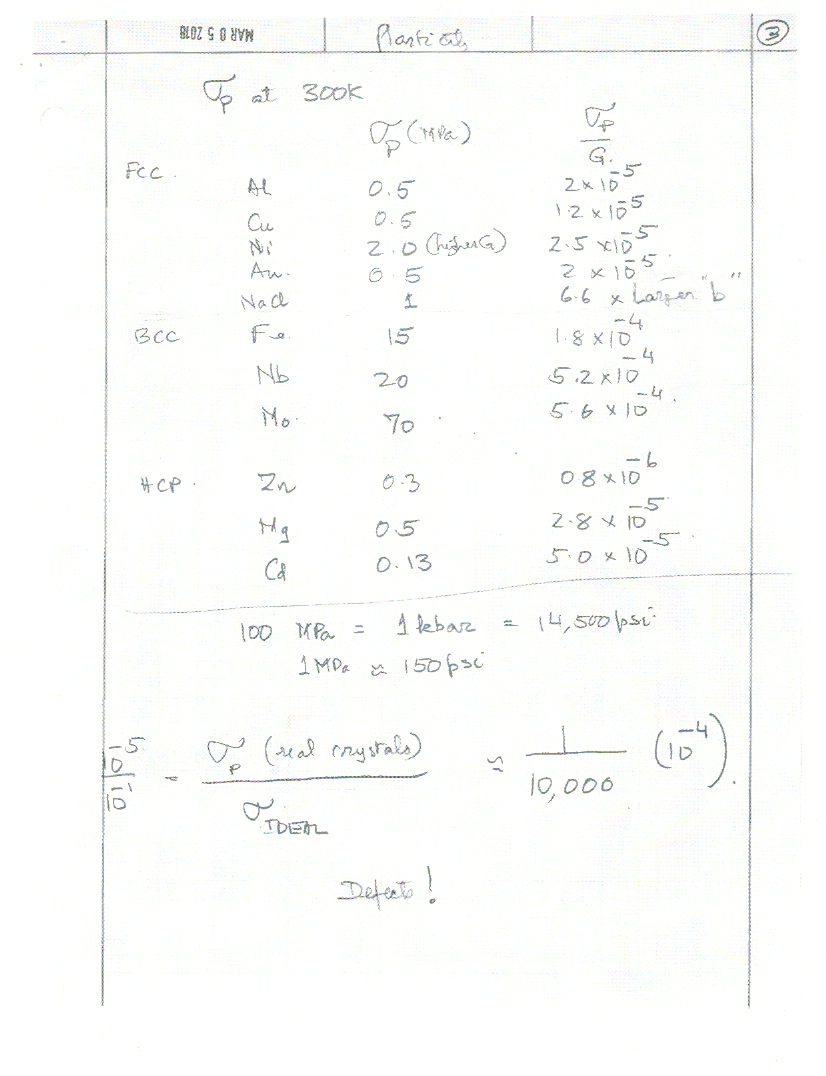
Measurments of the Yield Stress
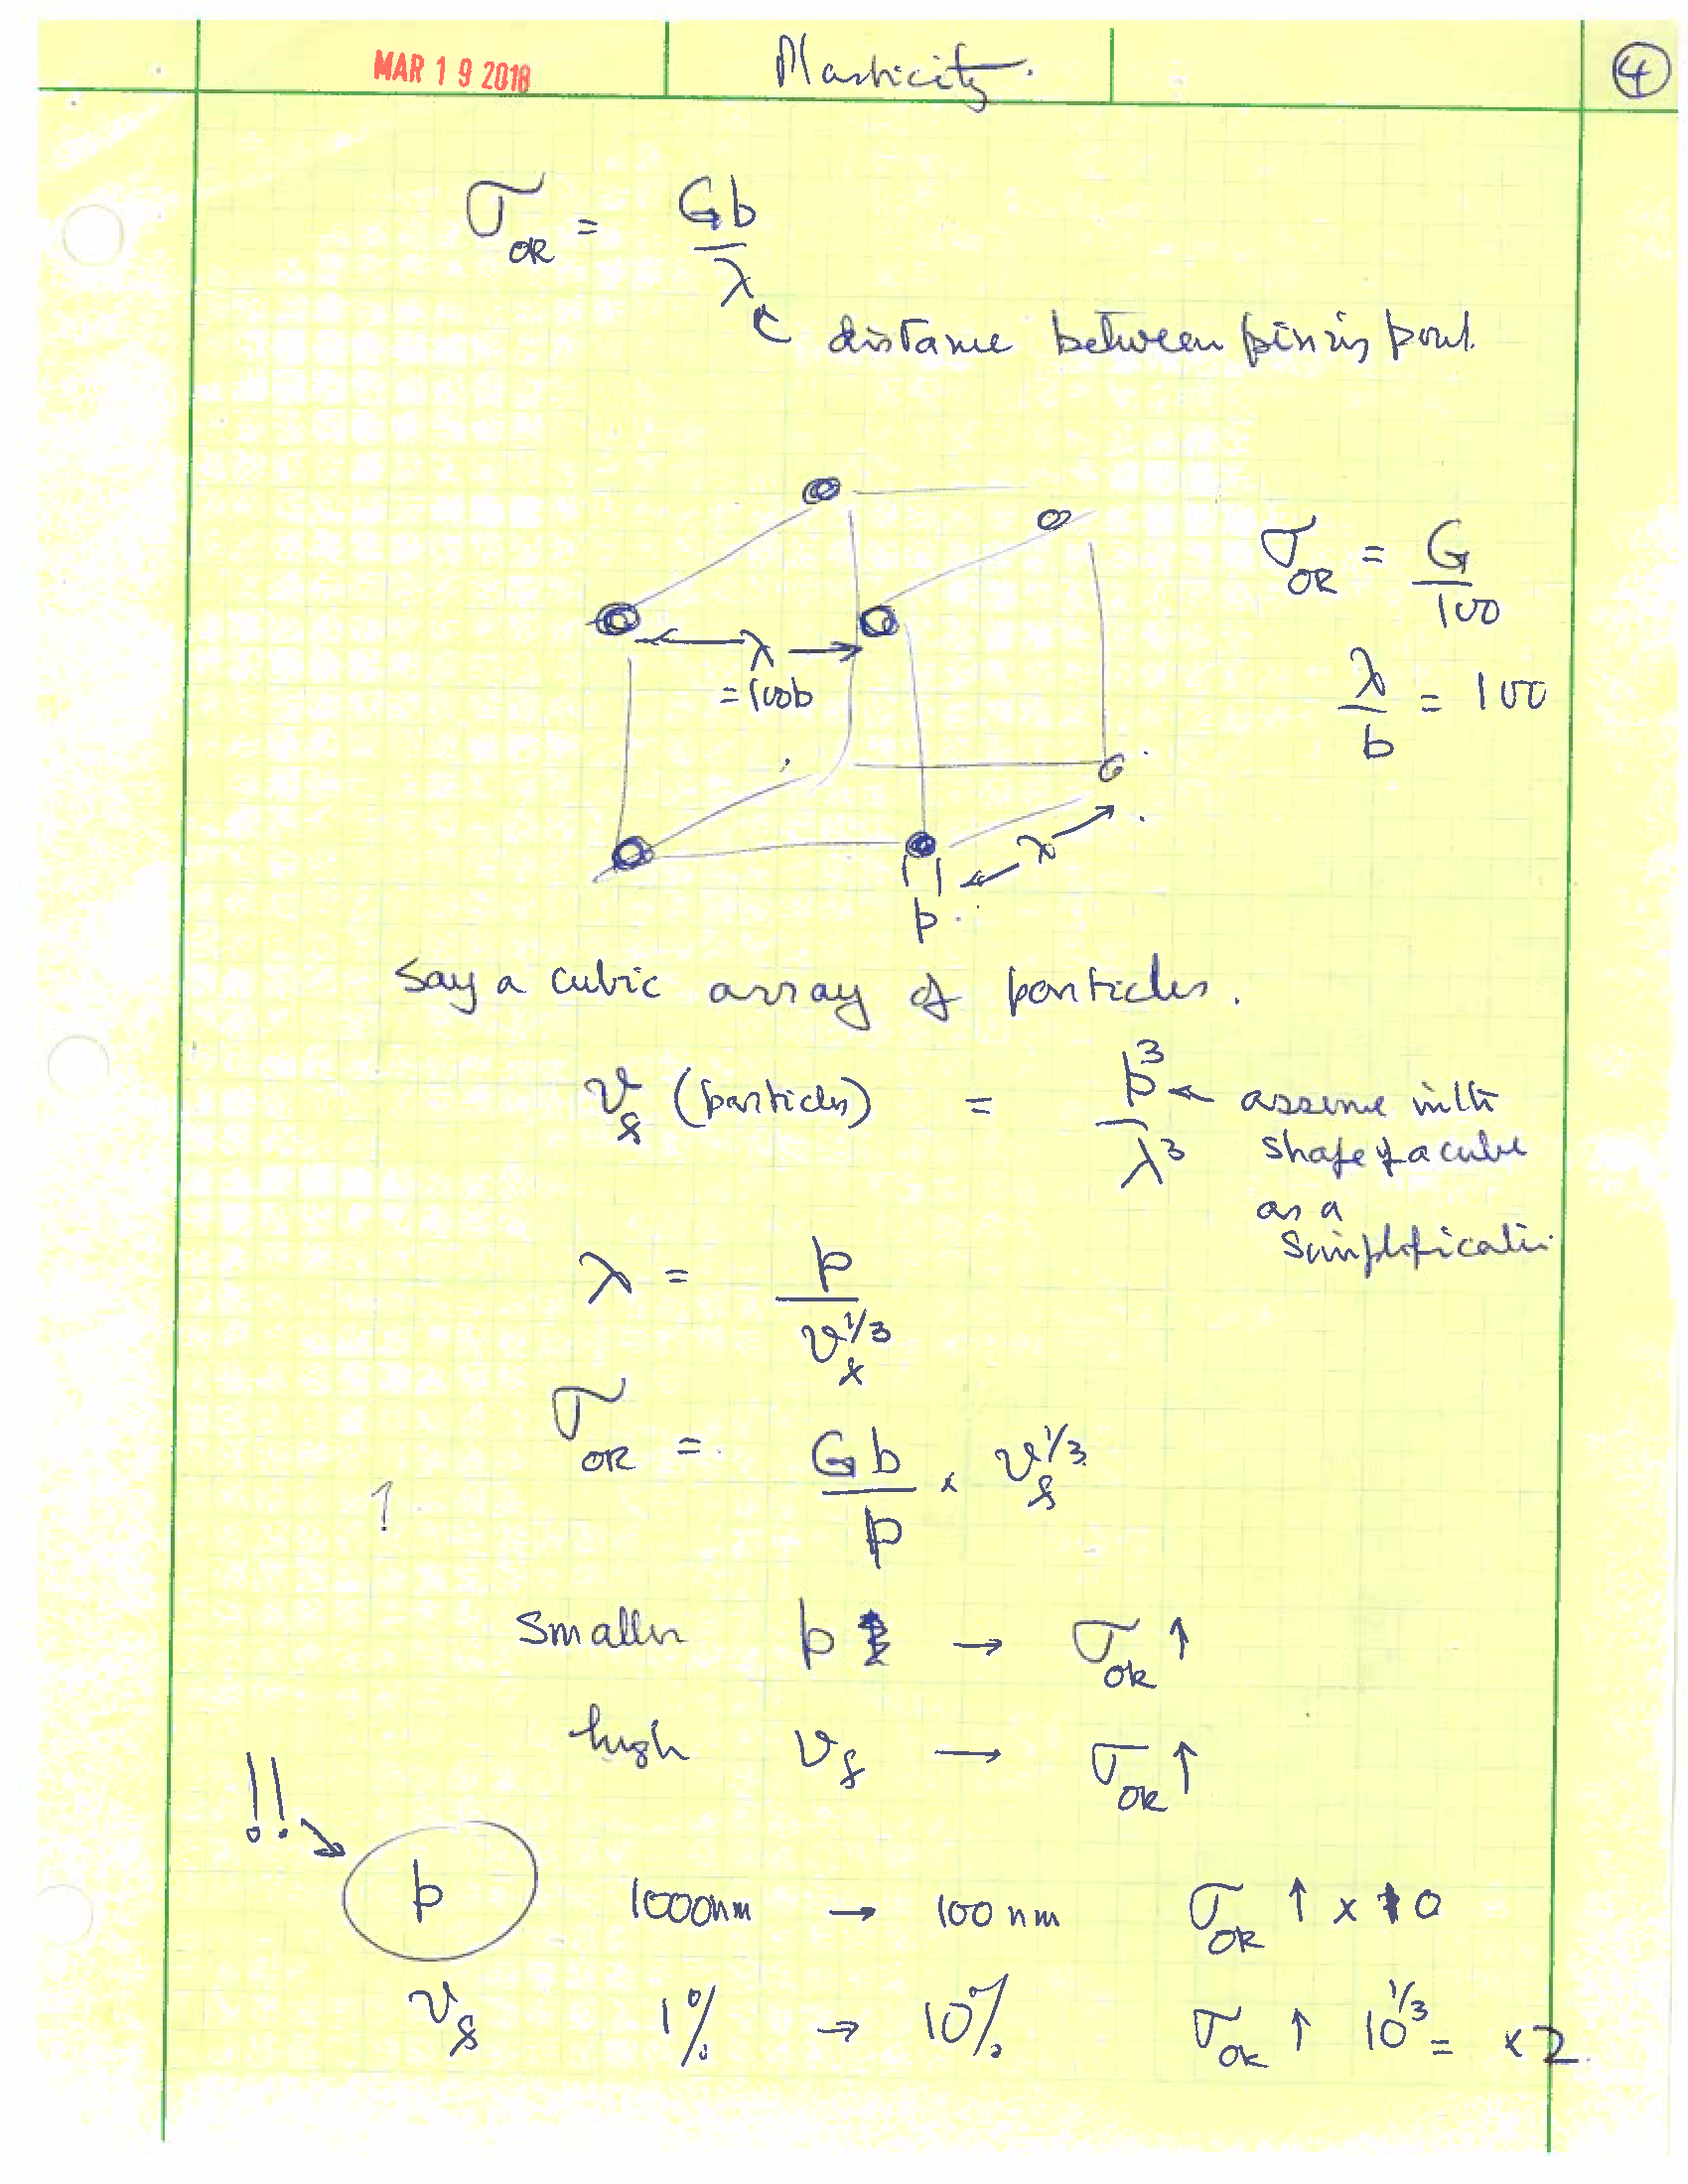
The ideal shear yield stress of perfect crystals amounts to about 10% of the shear modulus. As shown on the left the actual yield stress of metals can be several orders of magnitude lower.
Tensile stress of whiskers: needle like single crystals depends on the diameter of the whiskers. The yield stress keeps on rising as the whisher diameter decreases, approaching the ideal yield stress because defects are less probable as the specimen size decreases
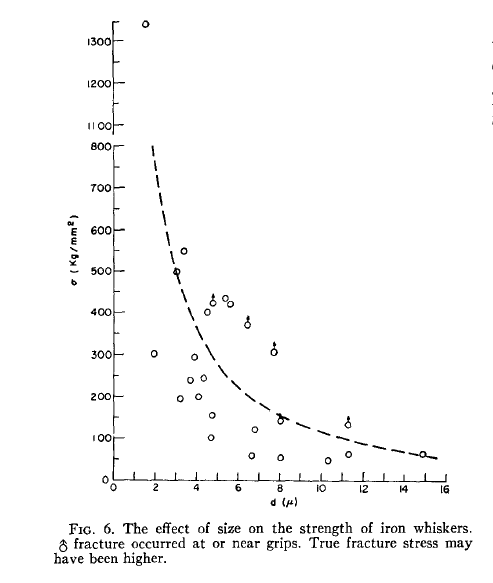
The figure on the left shows the rise in the yield stress of whiskers of iron. Change the units of the yield stress from Kg/mm^2 to MPa and compare it to the shear modulus of iron to see how close it approached the ideal shear strength.
The full paper from which this figure has been derived is found in this paper by Brenner.
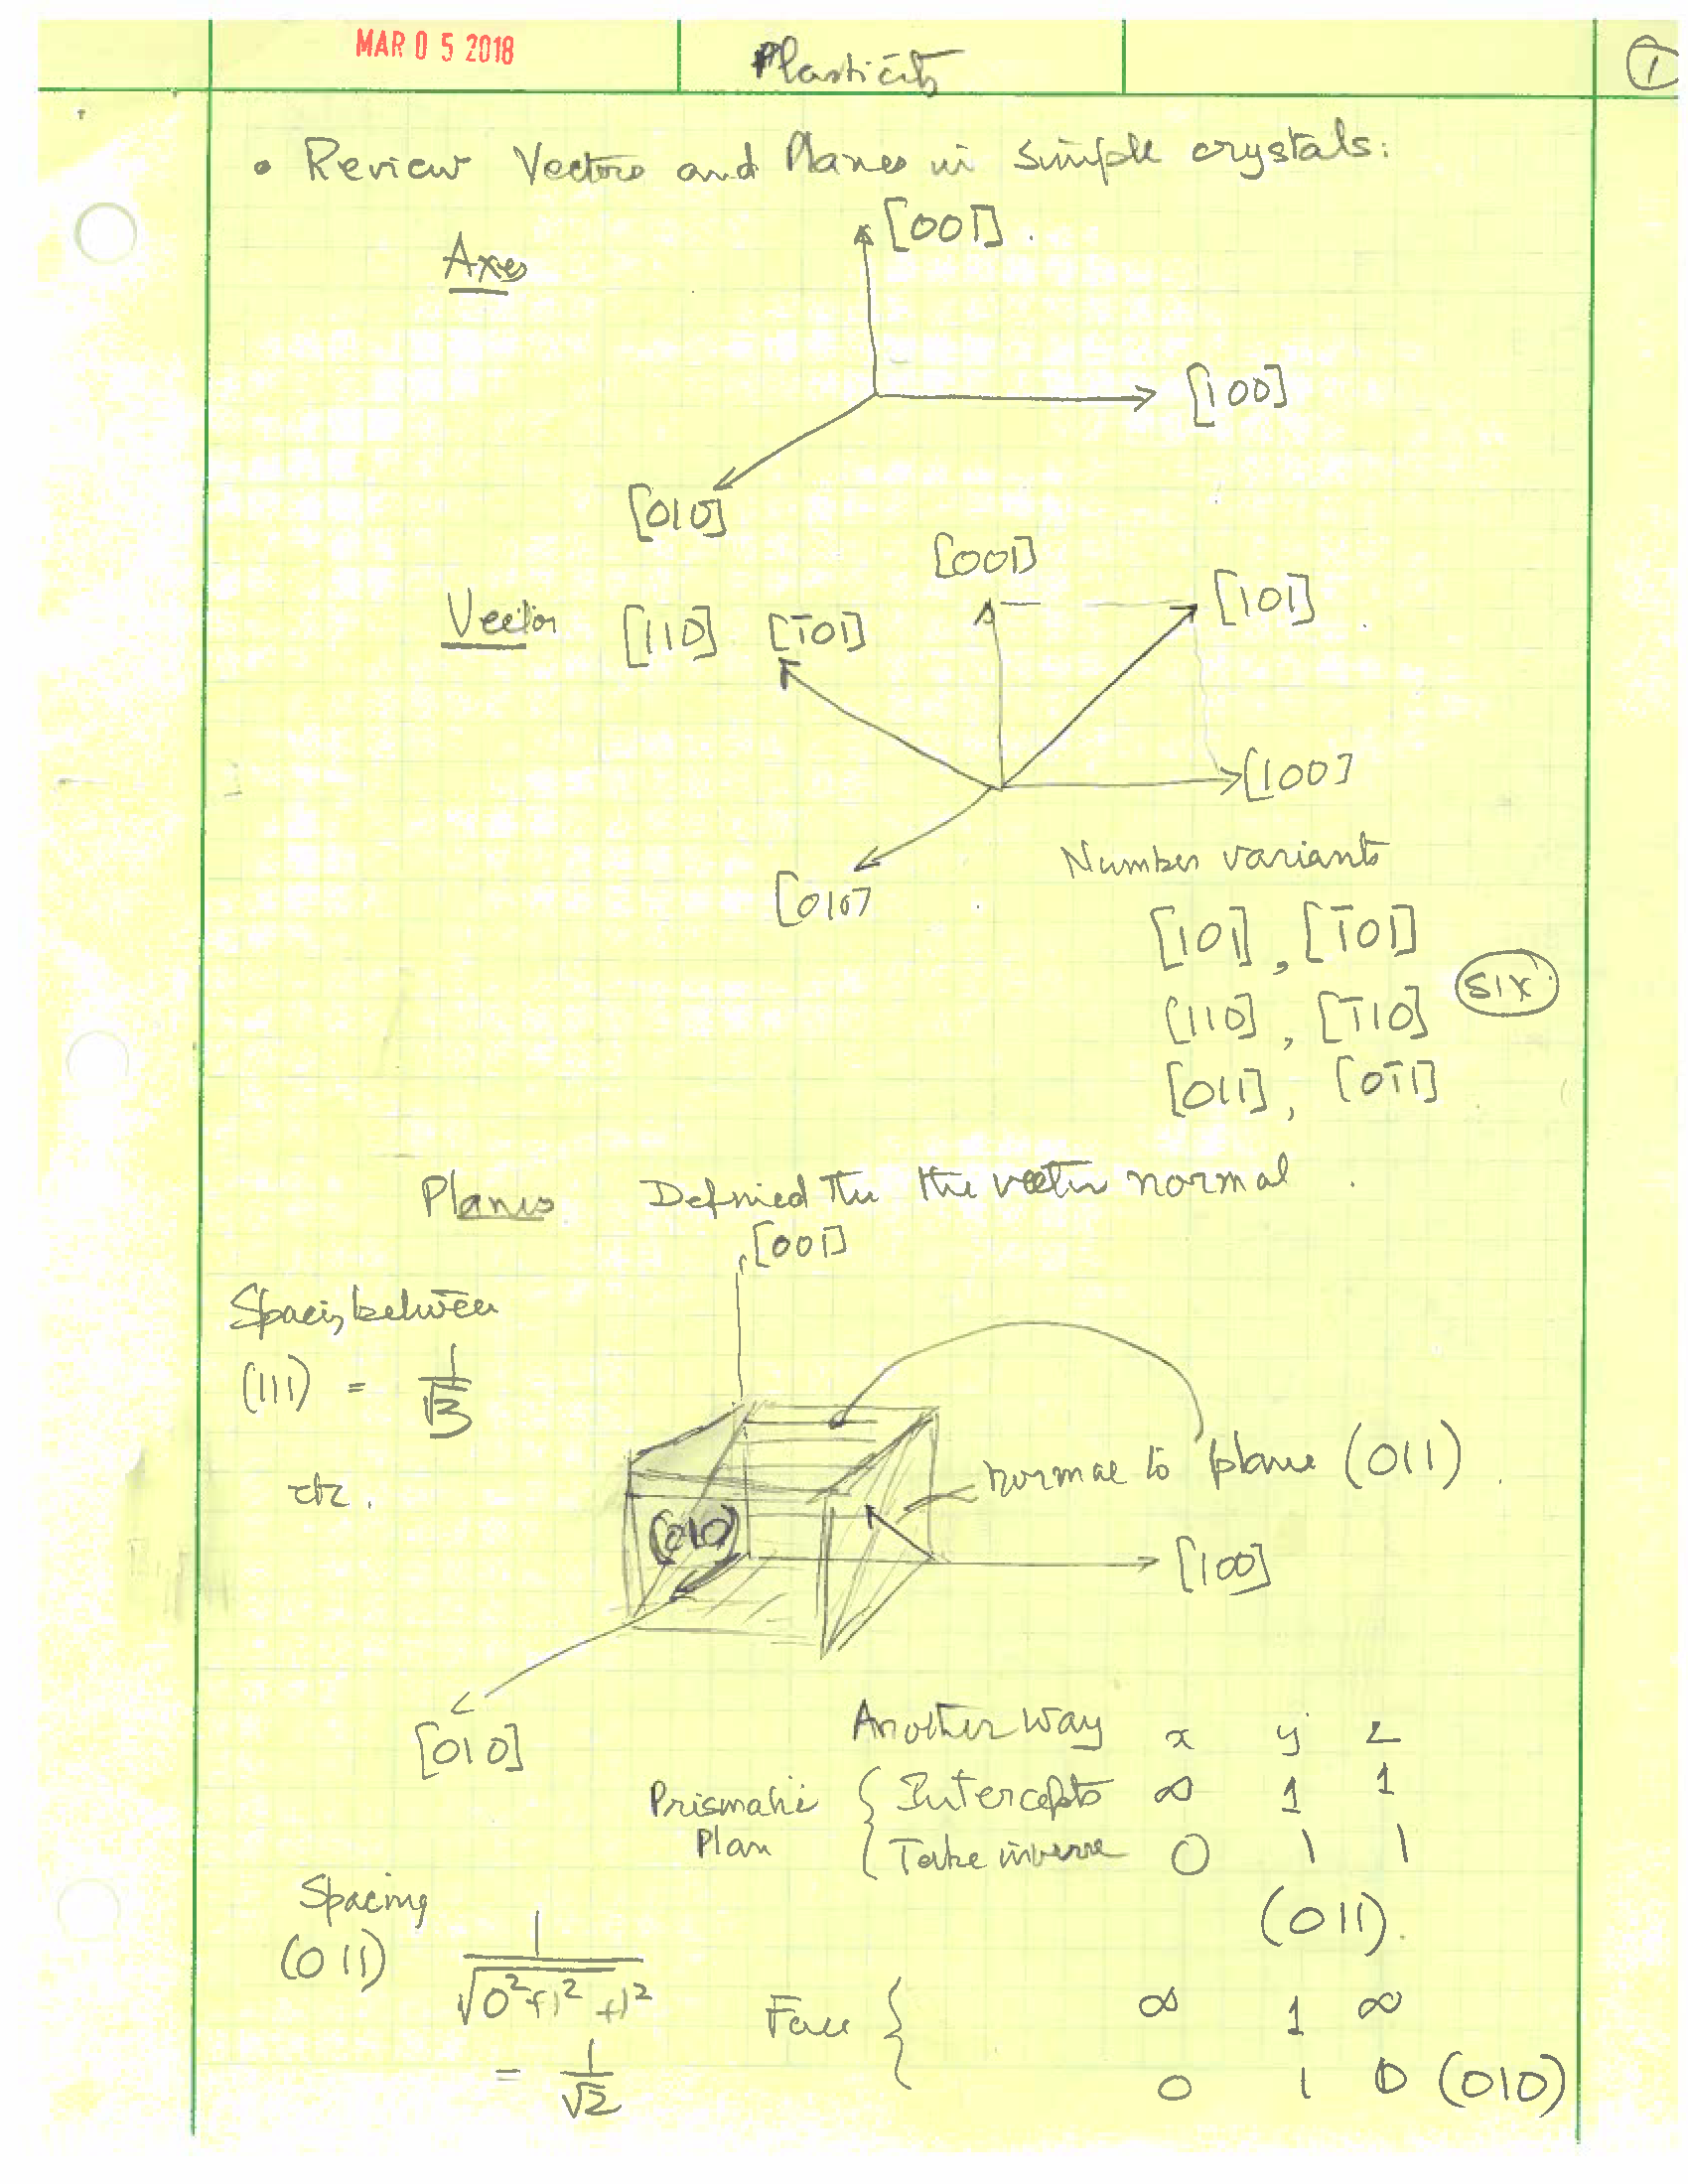
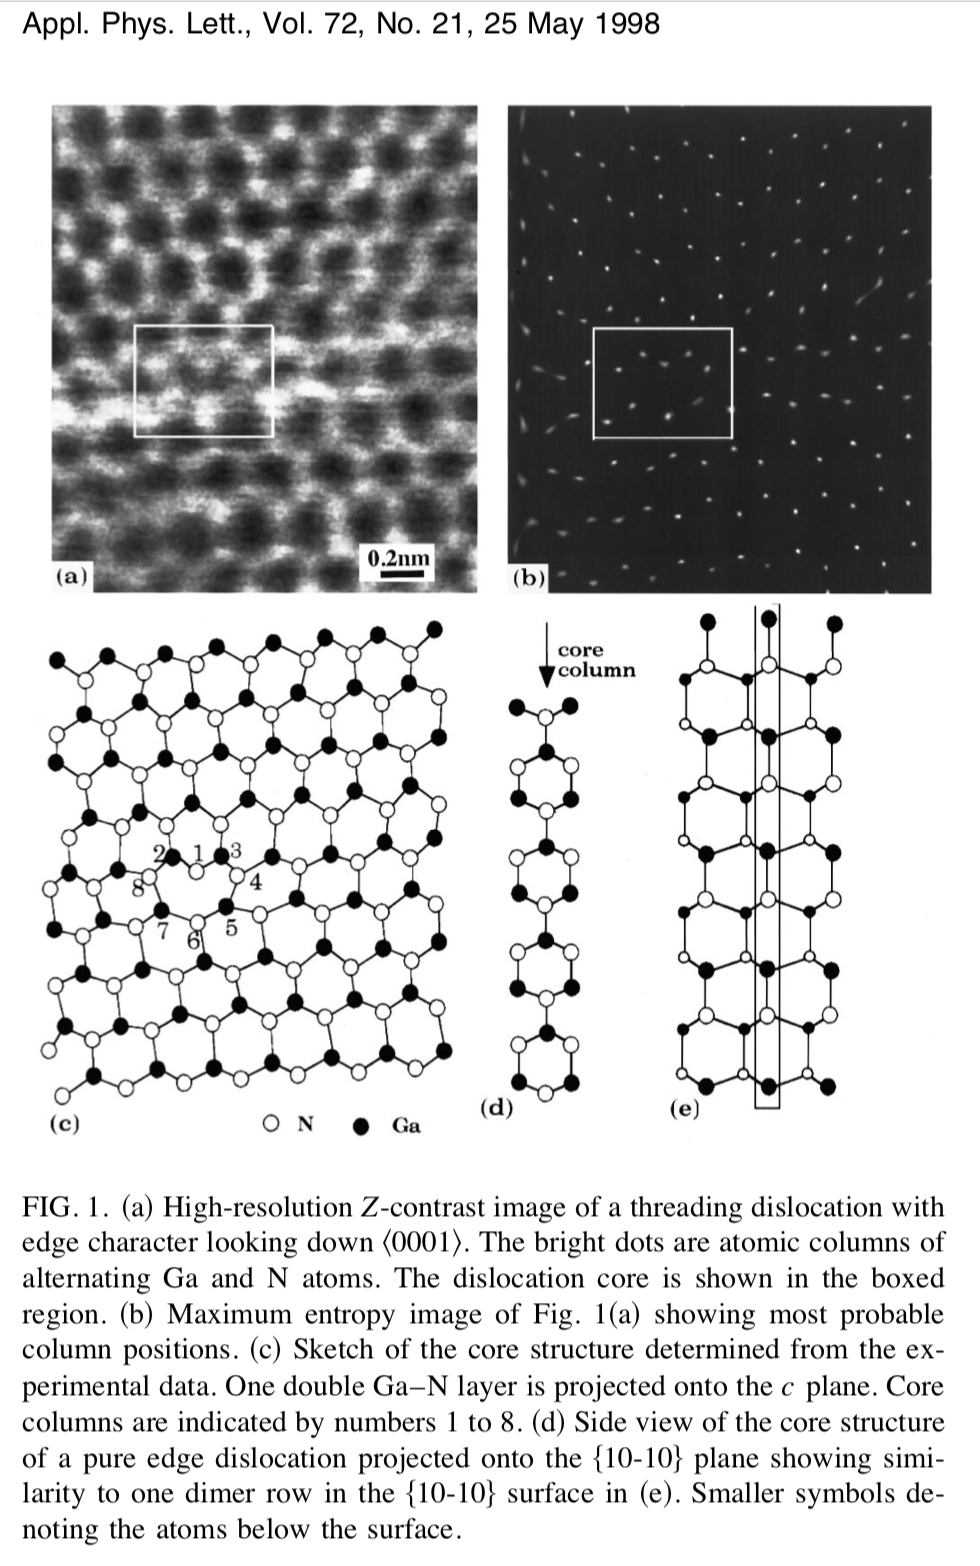
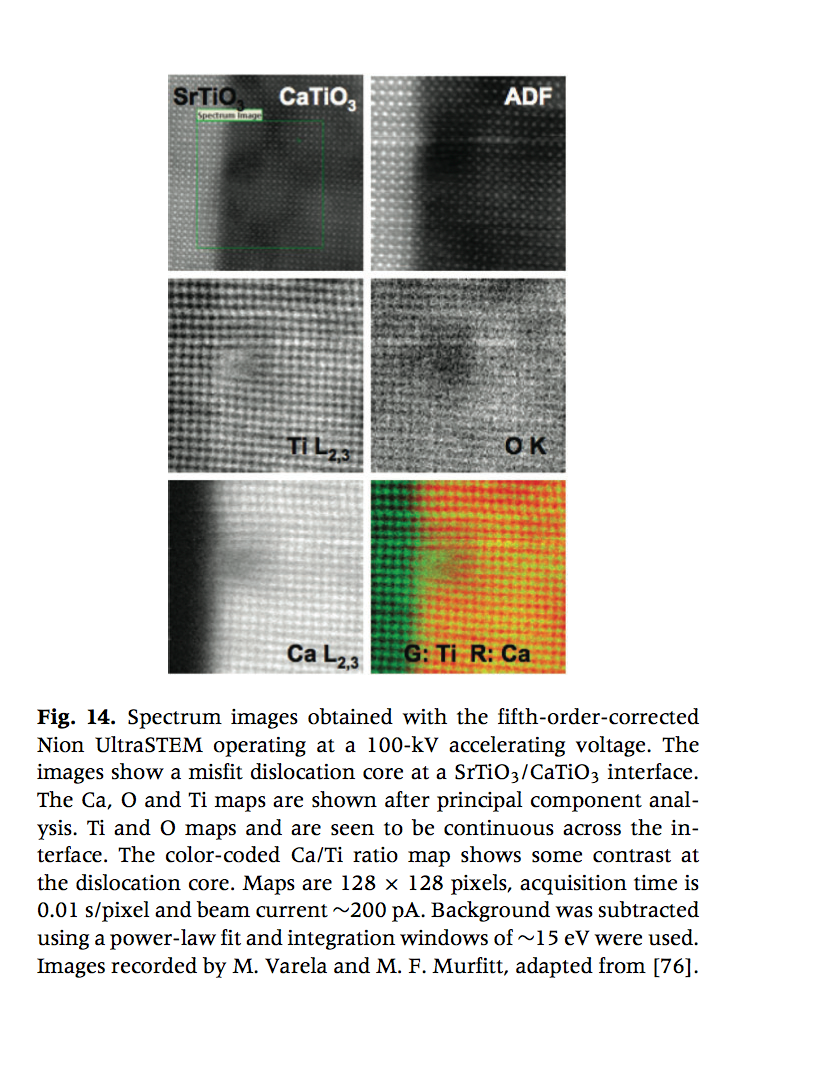
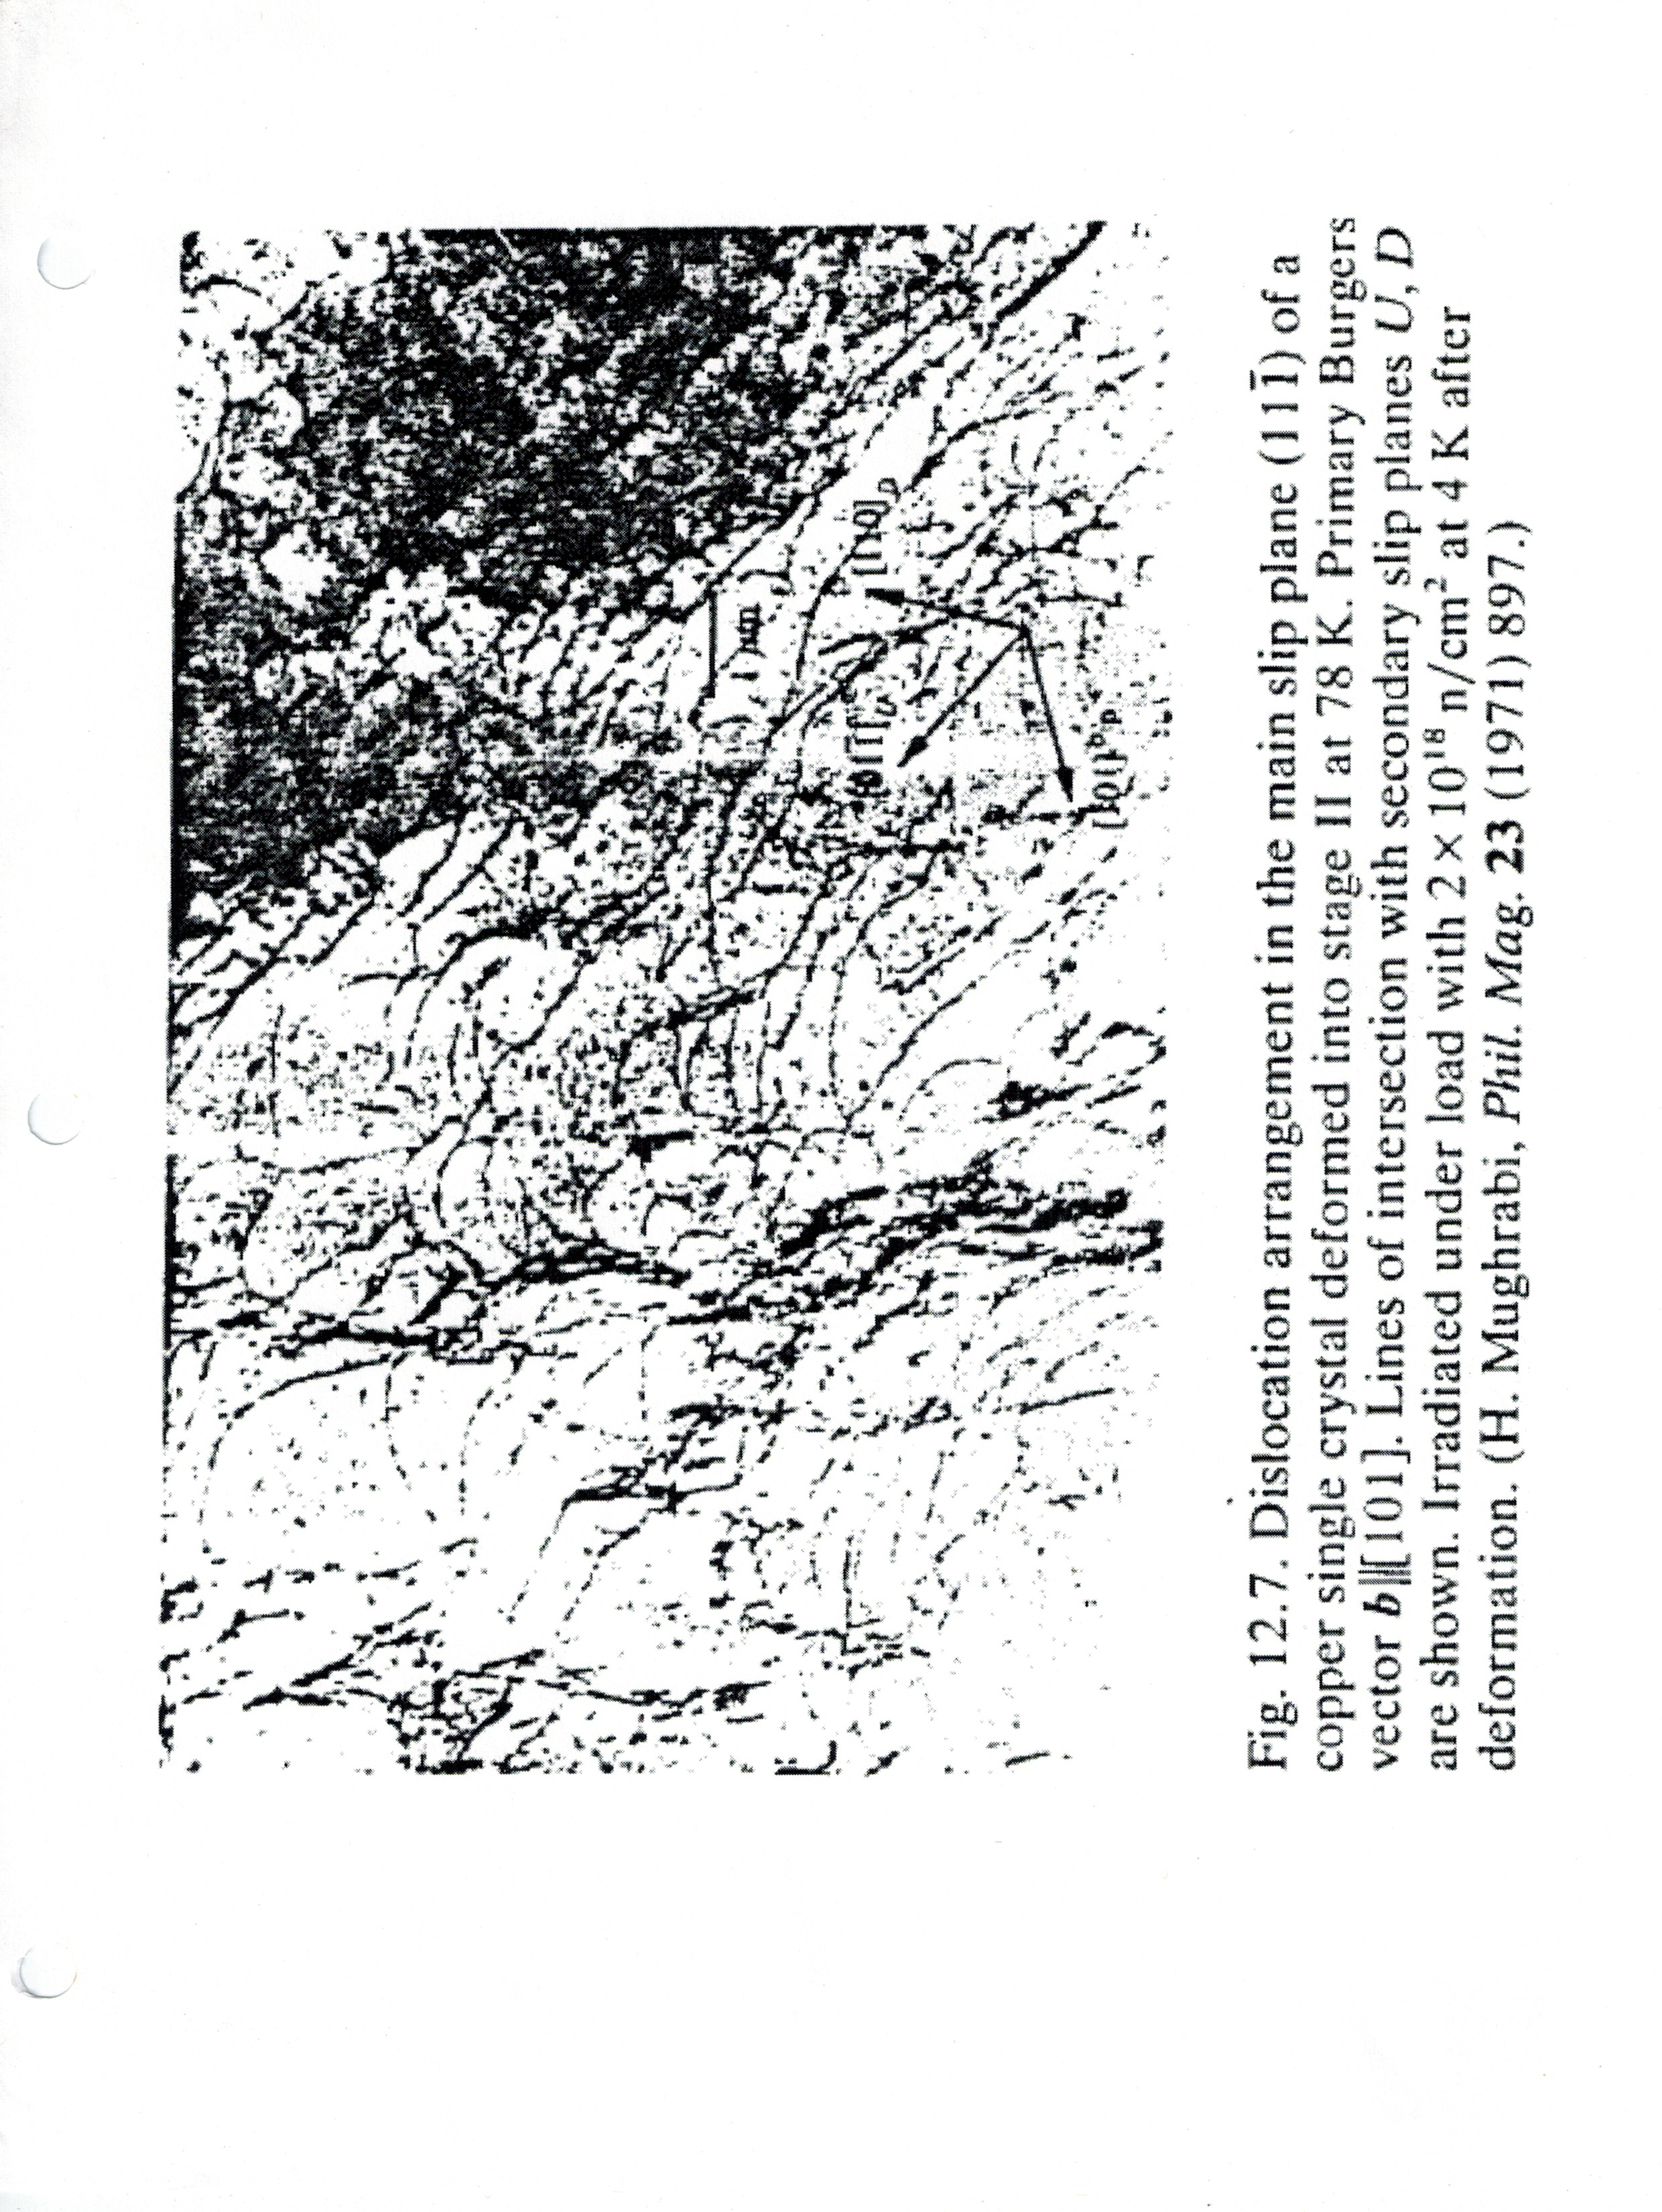
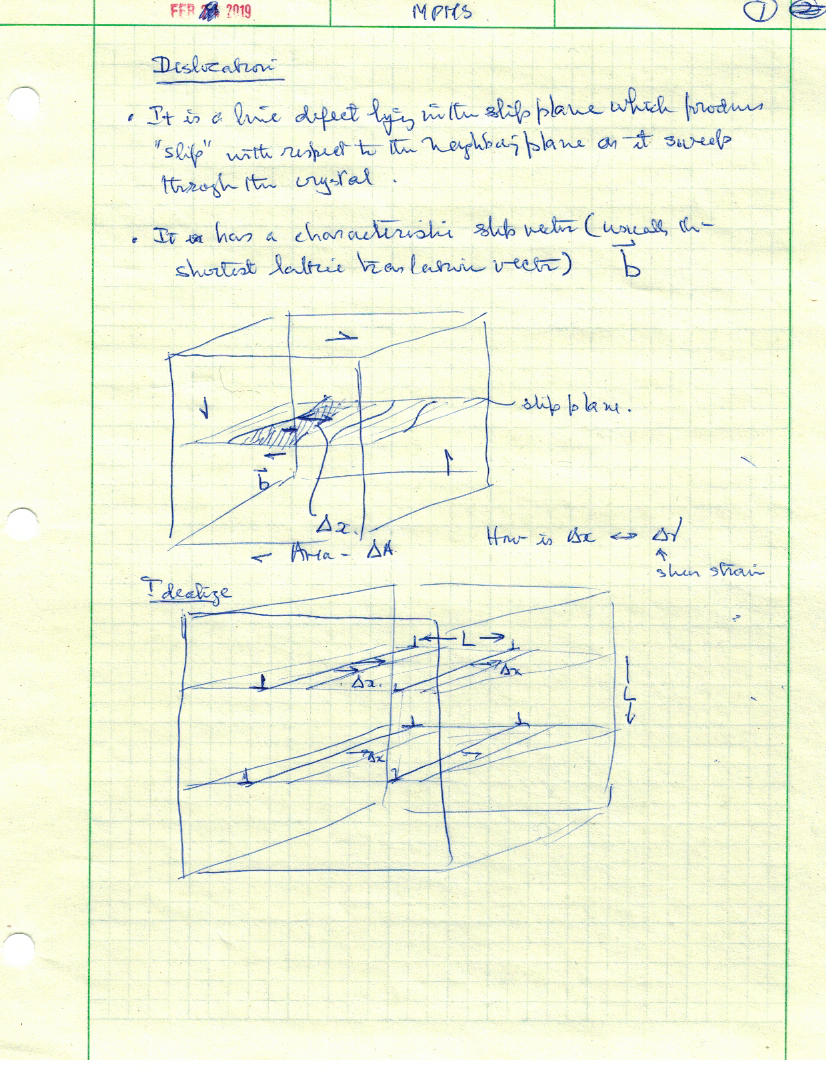
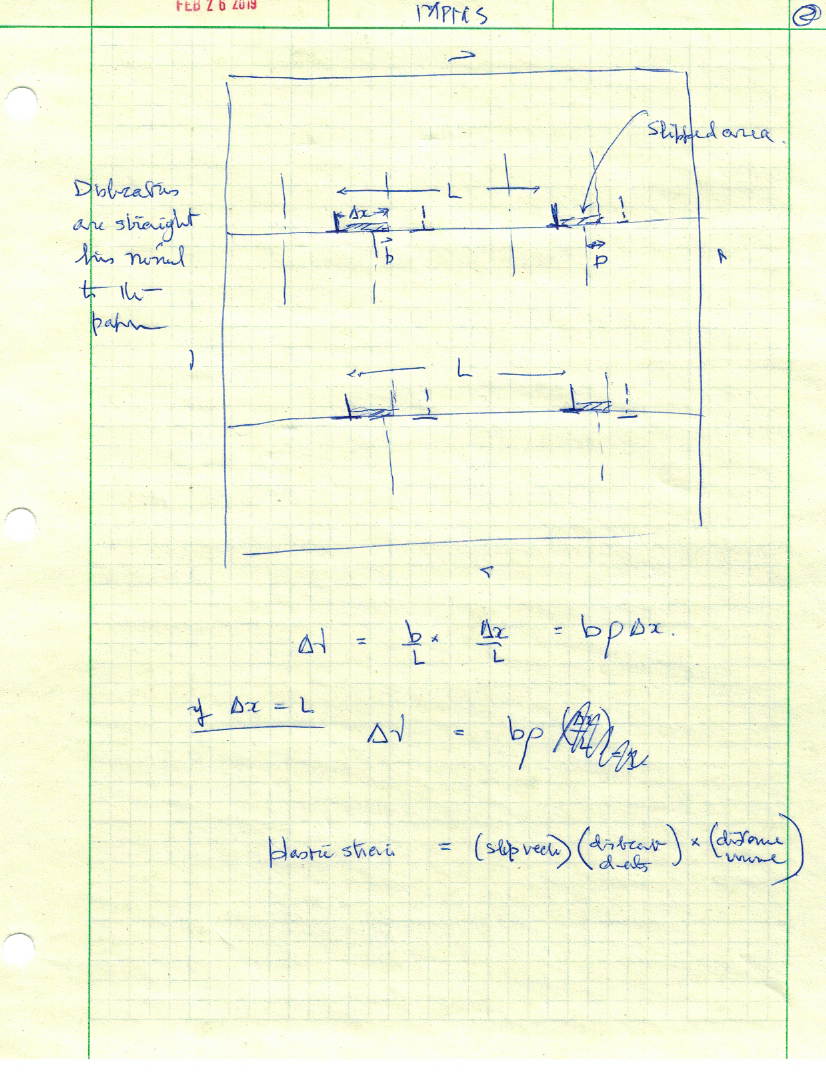
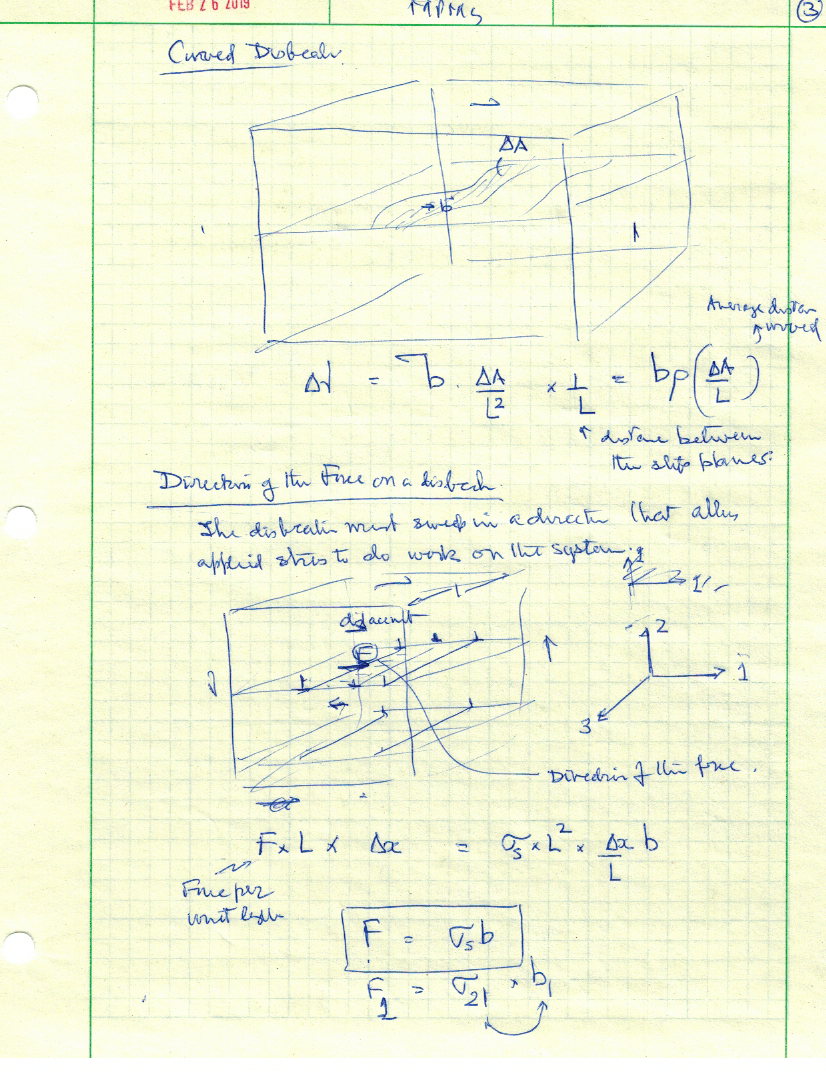
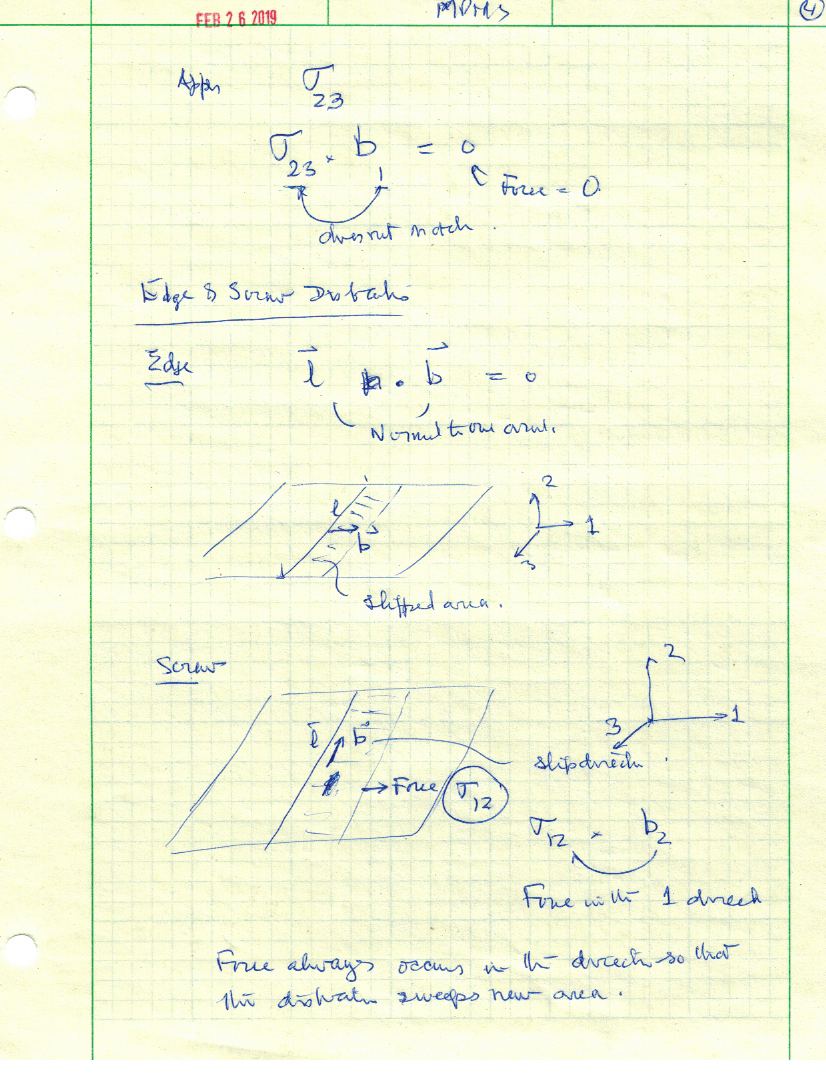
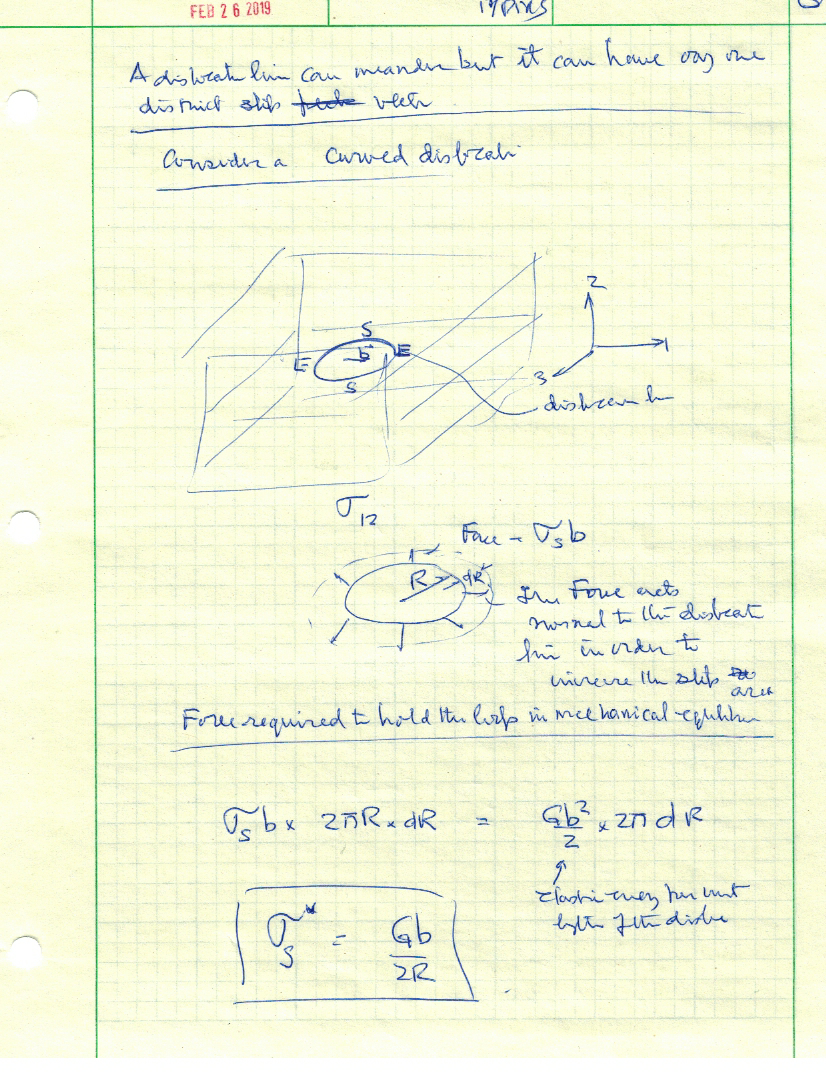
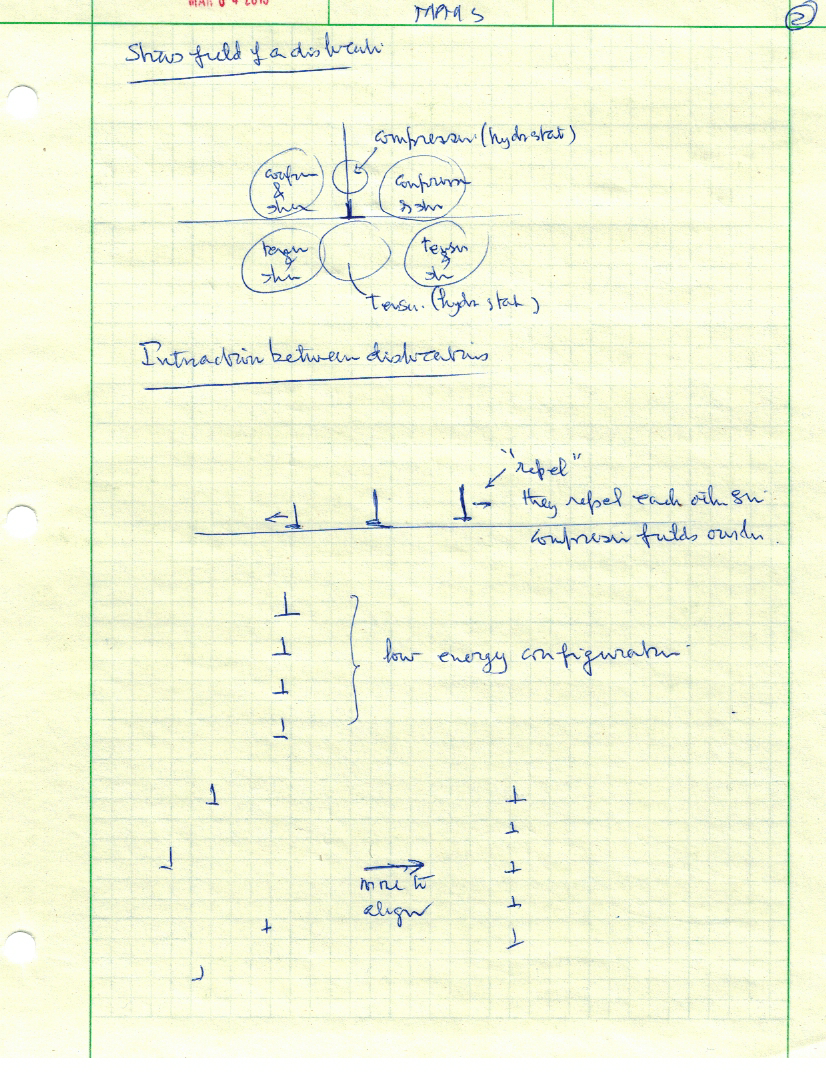
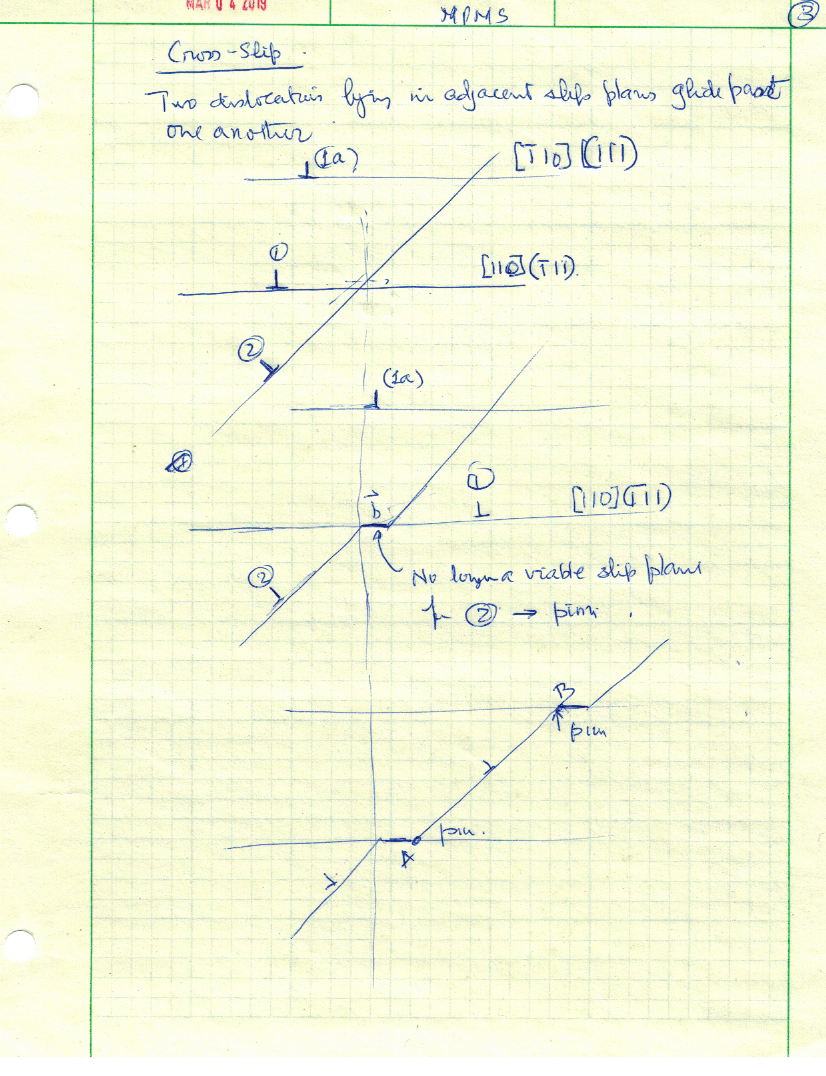
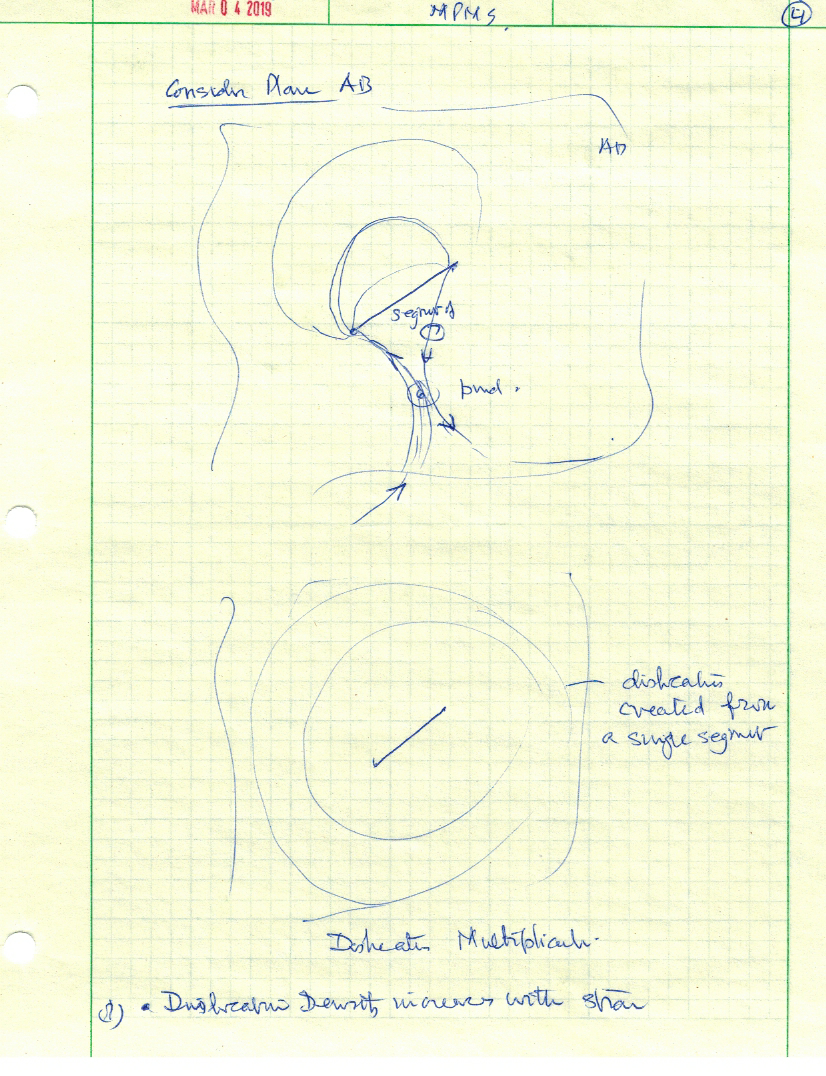
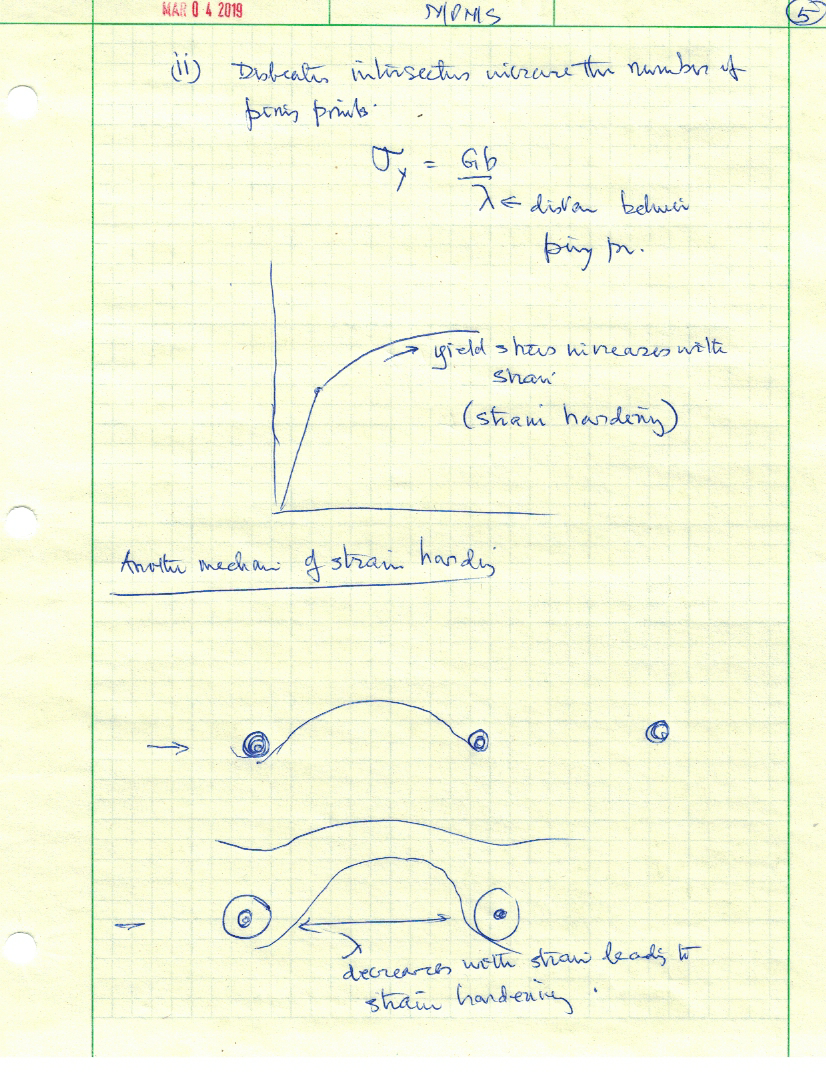
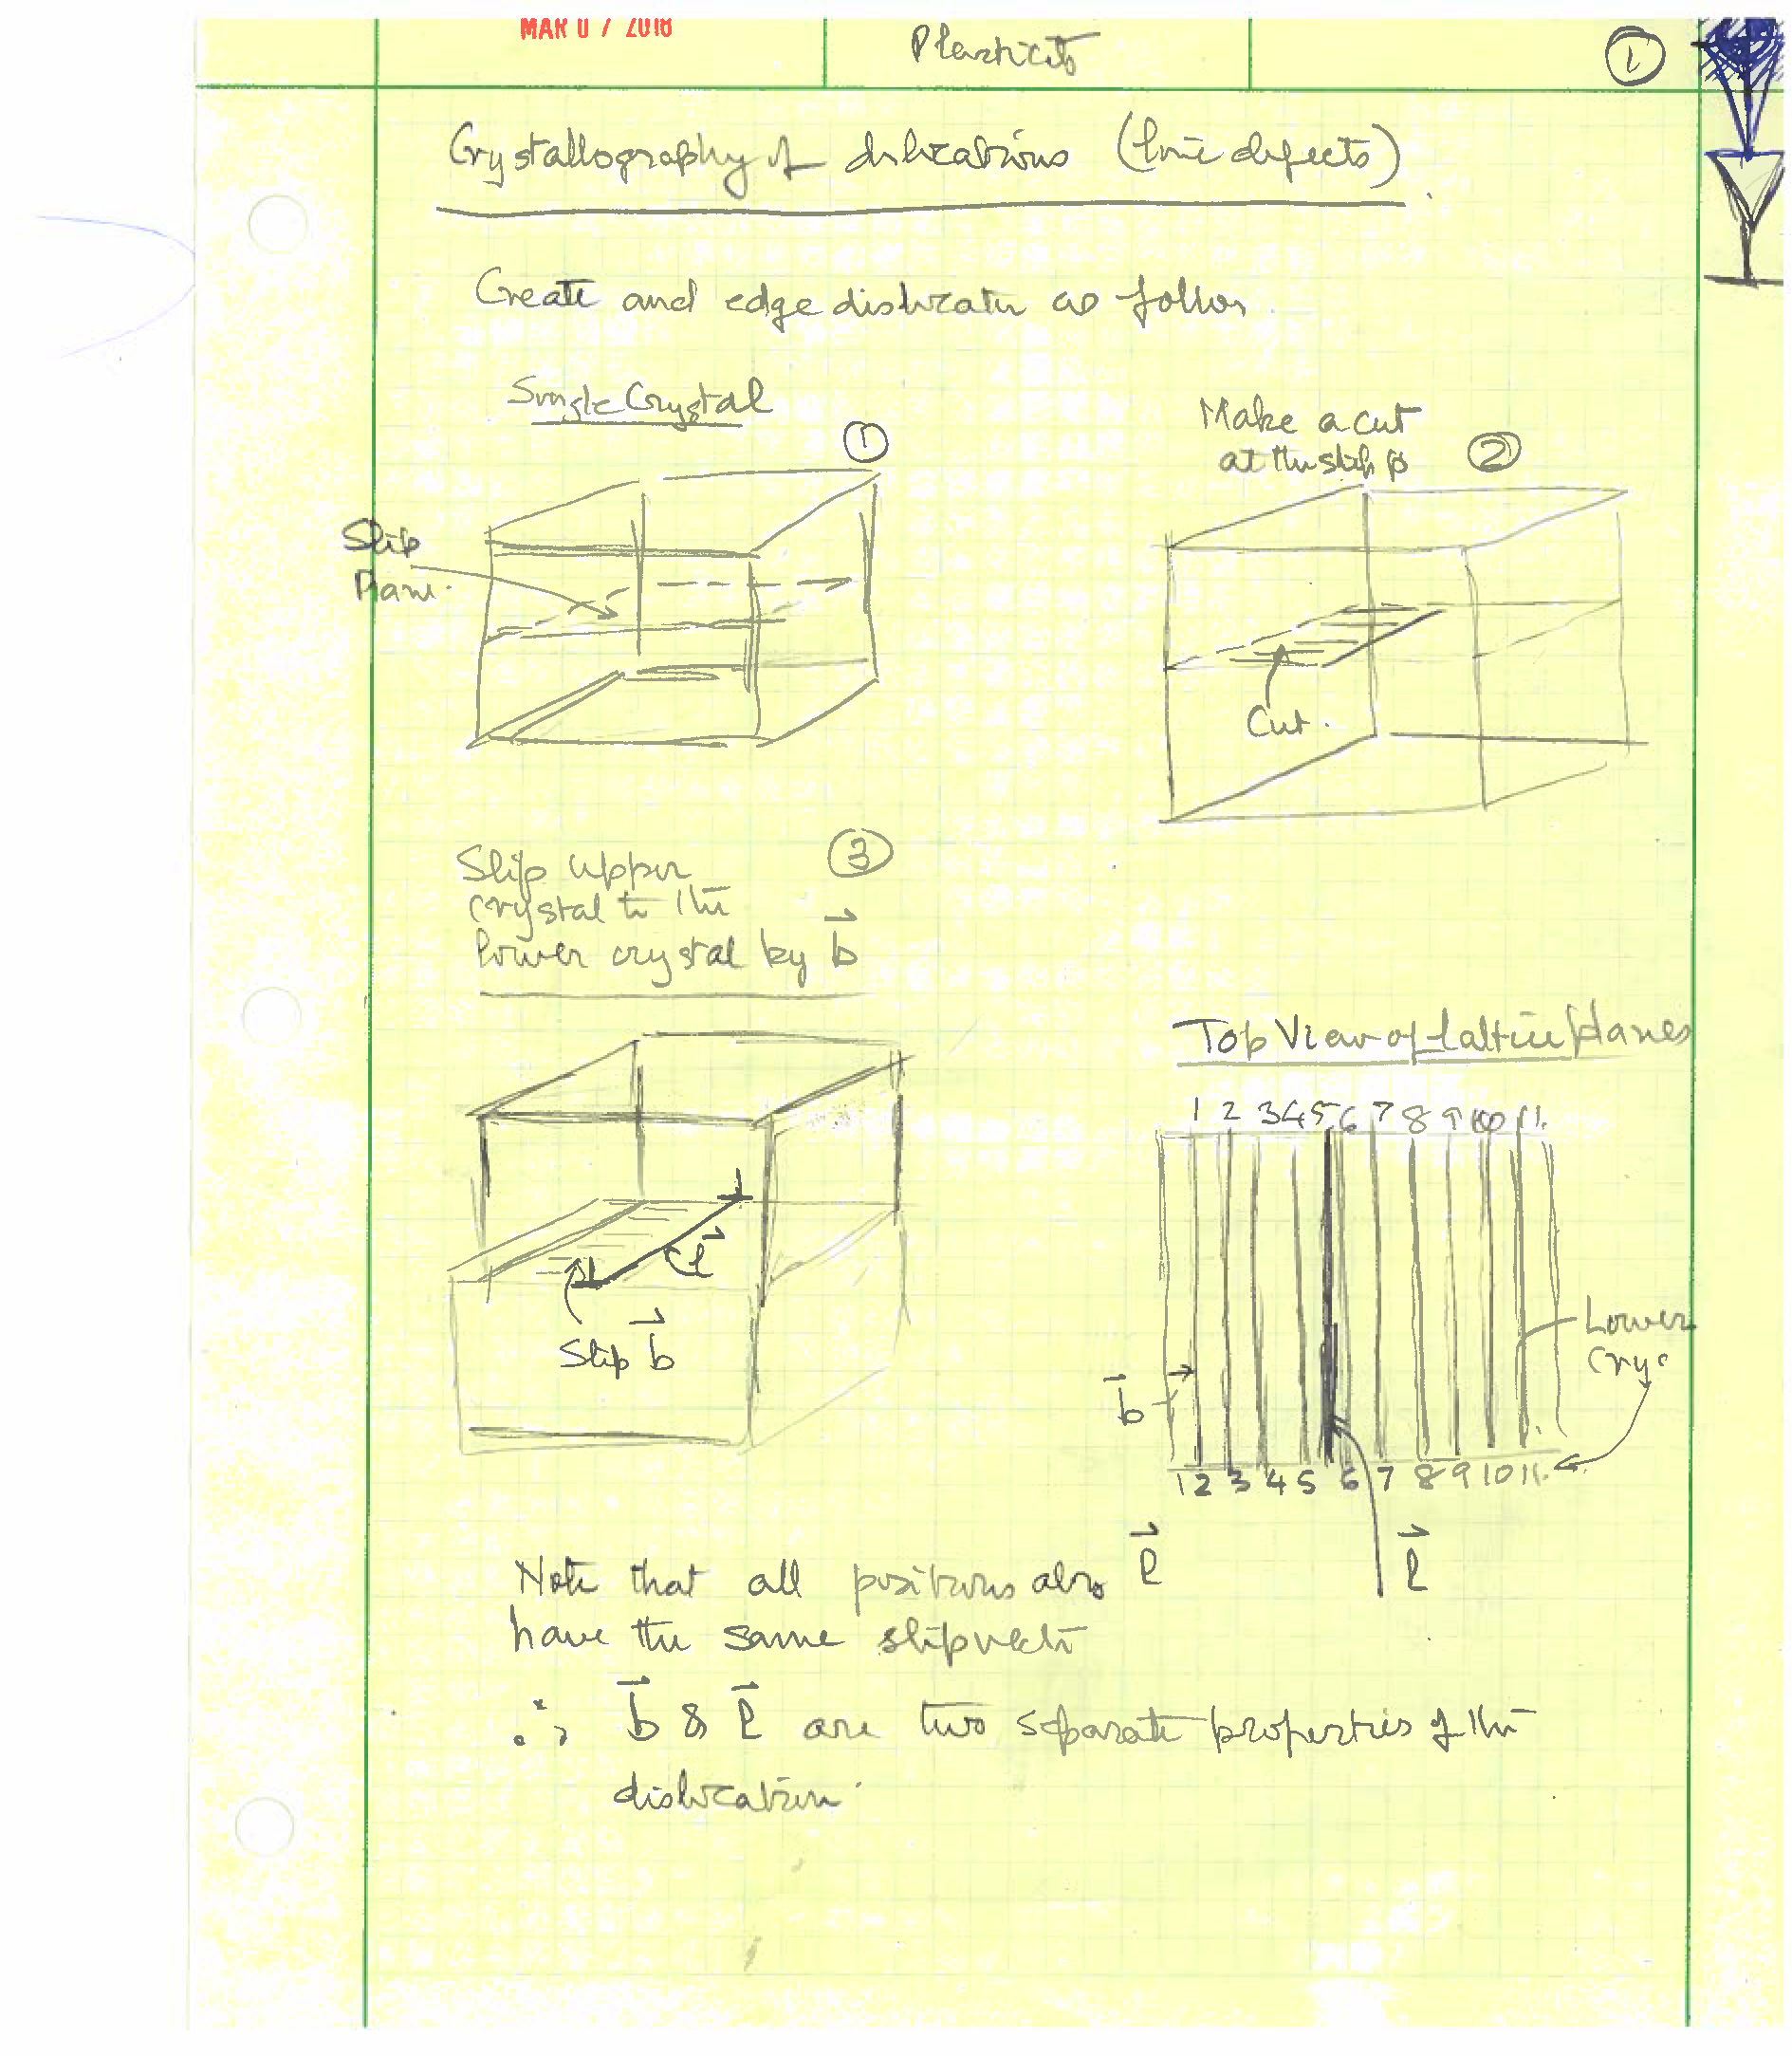
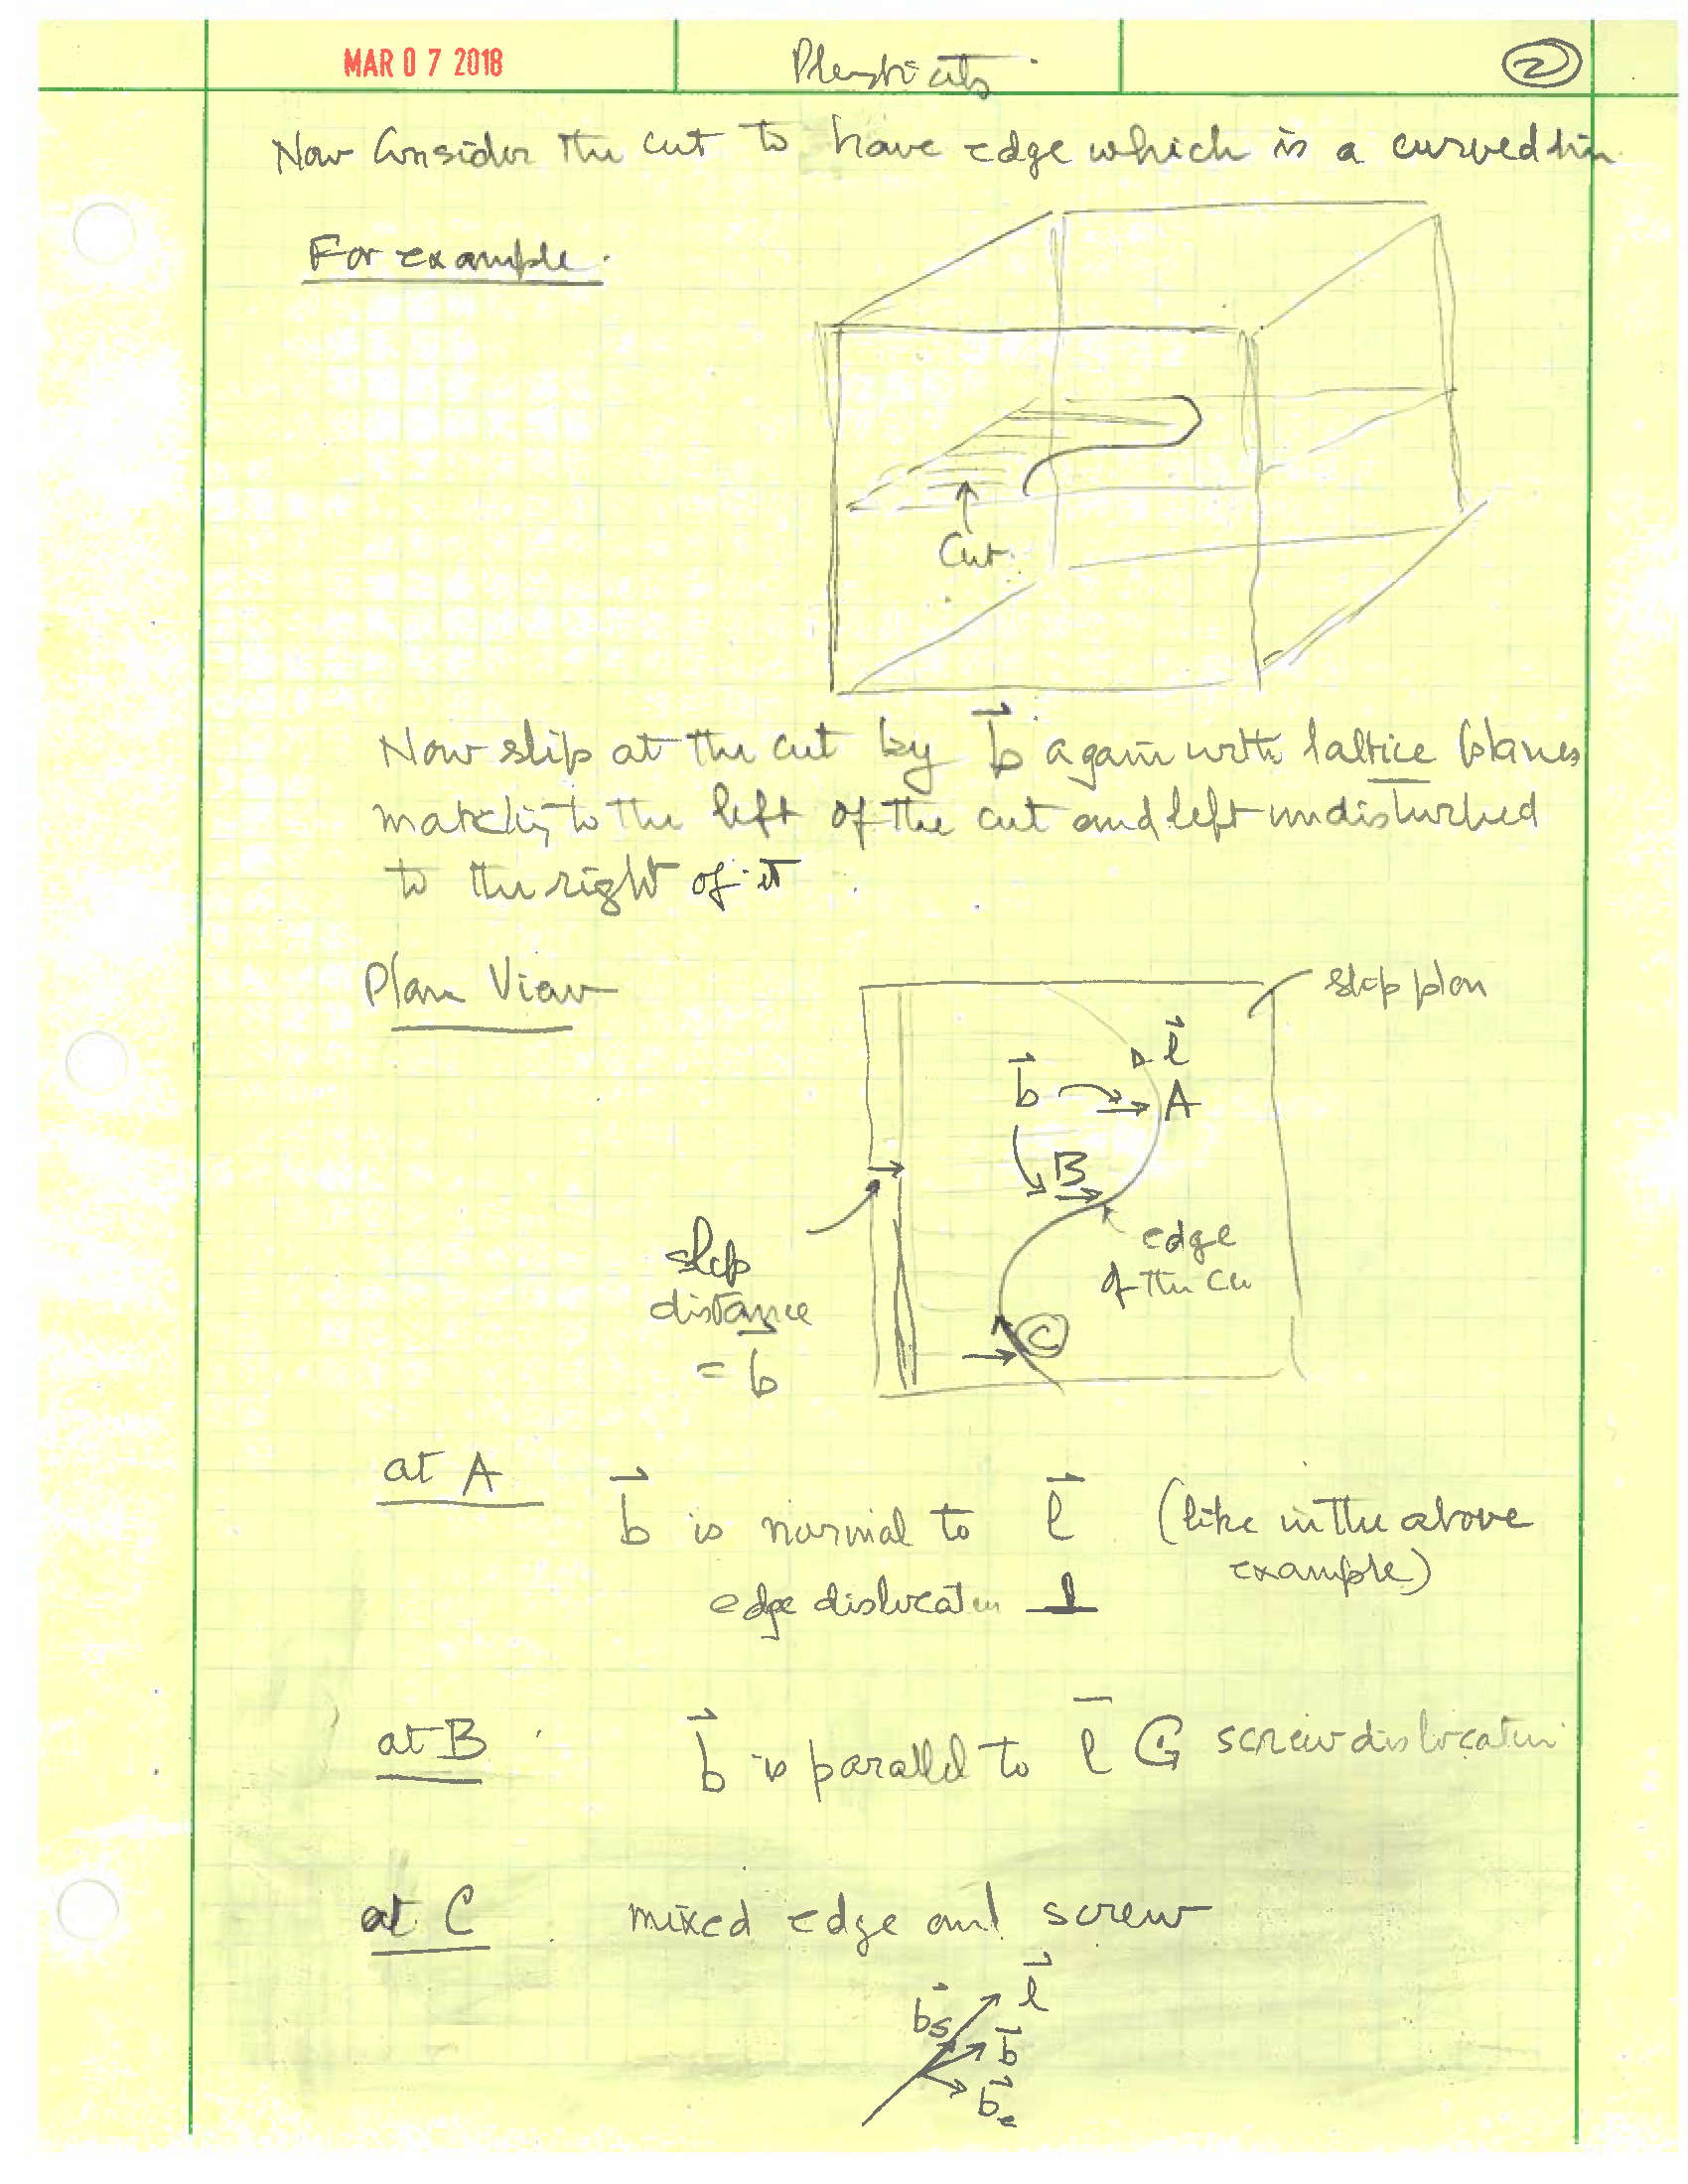
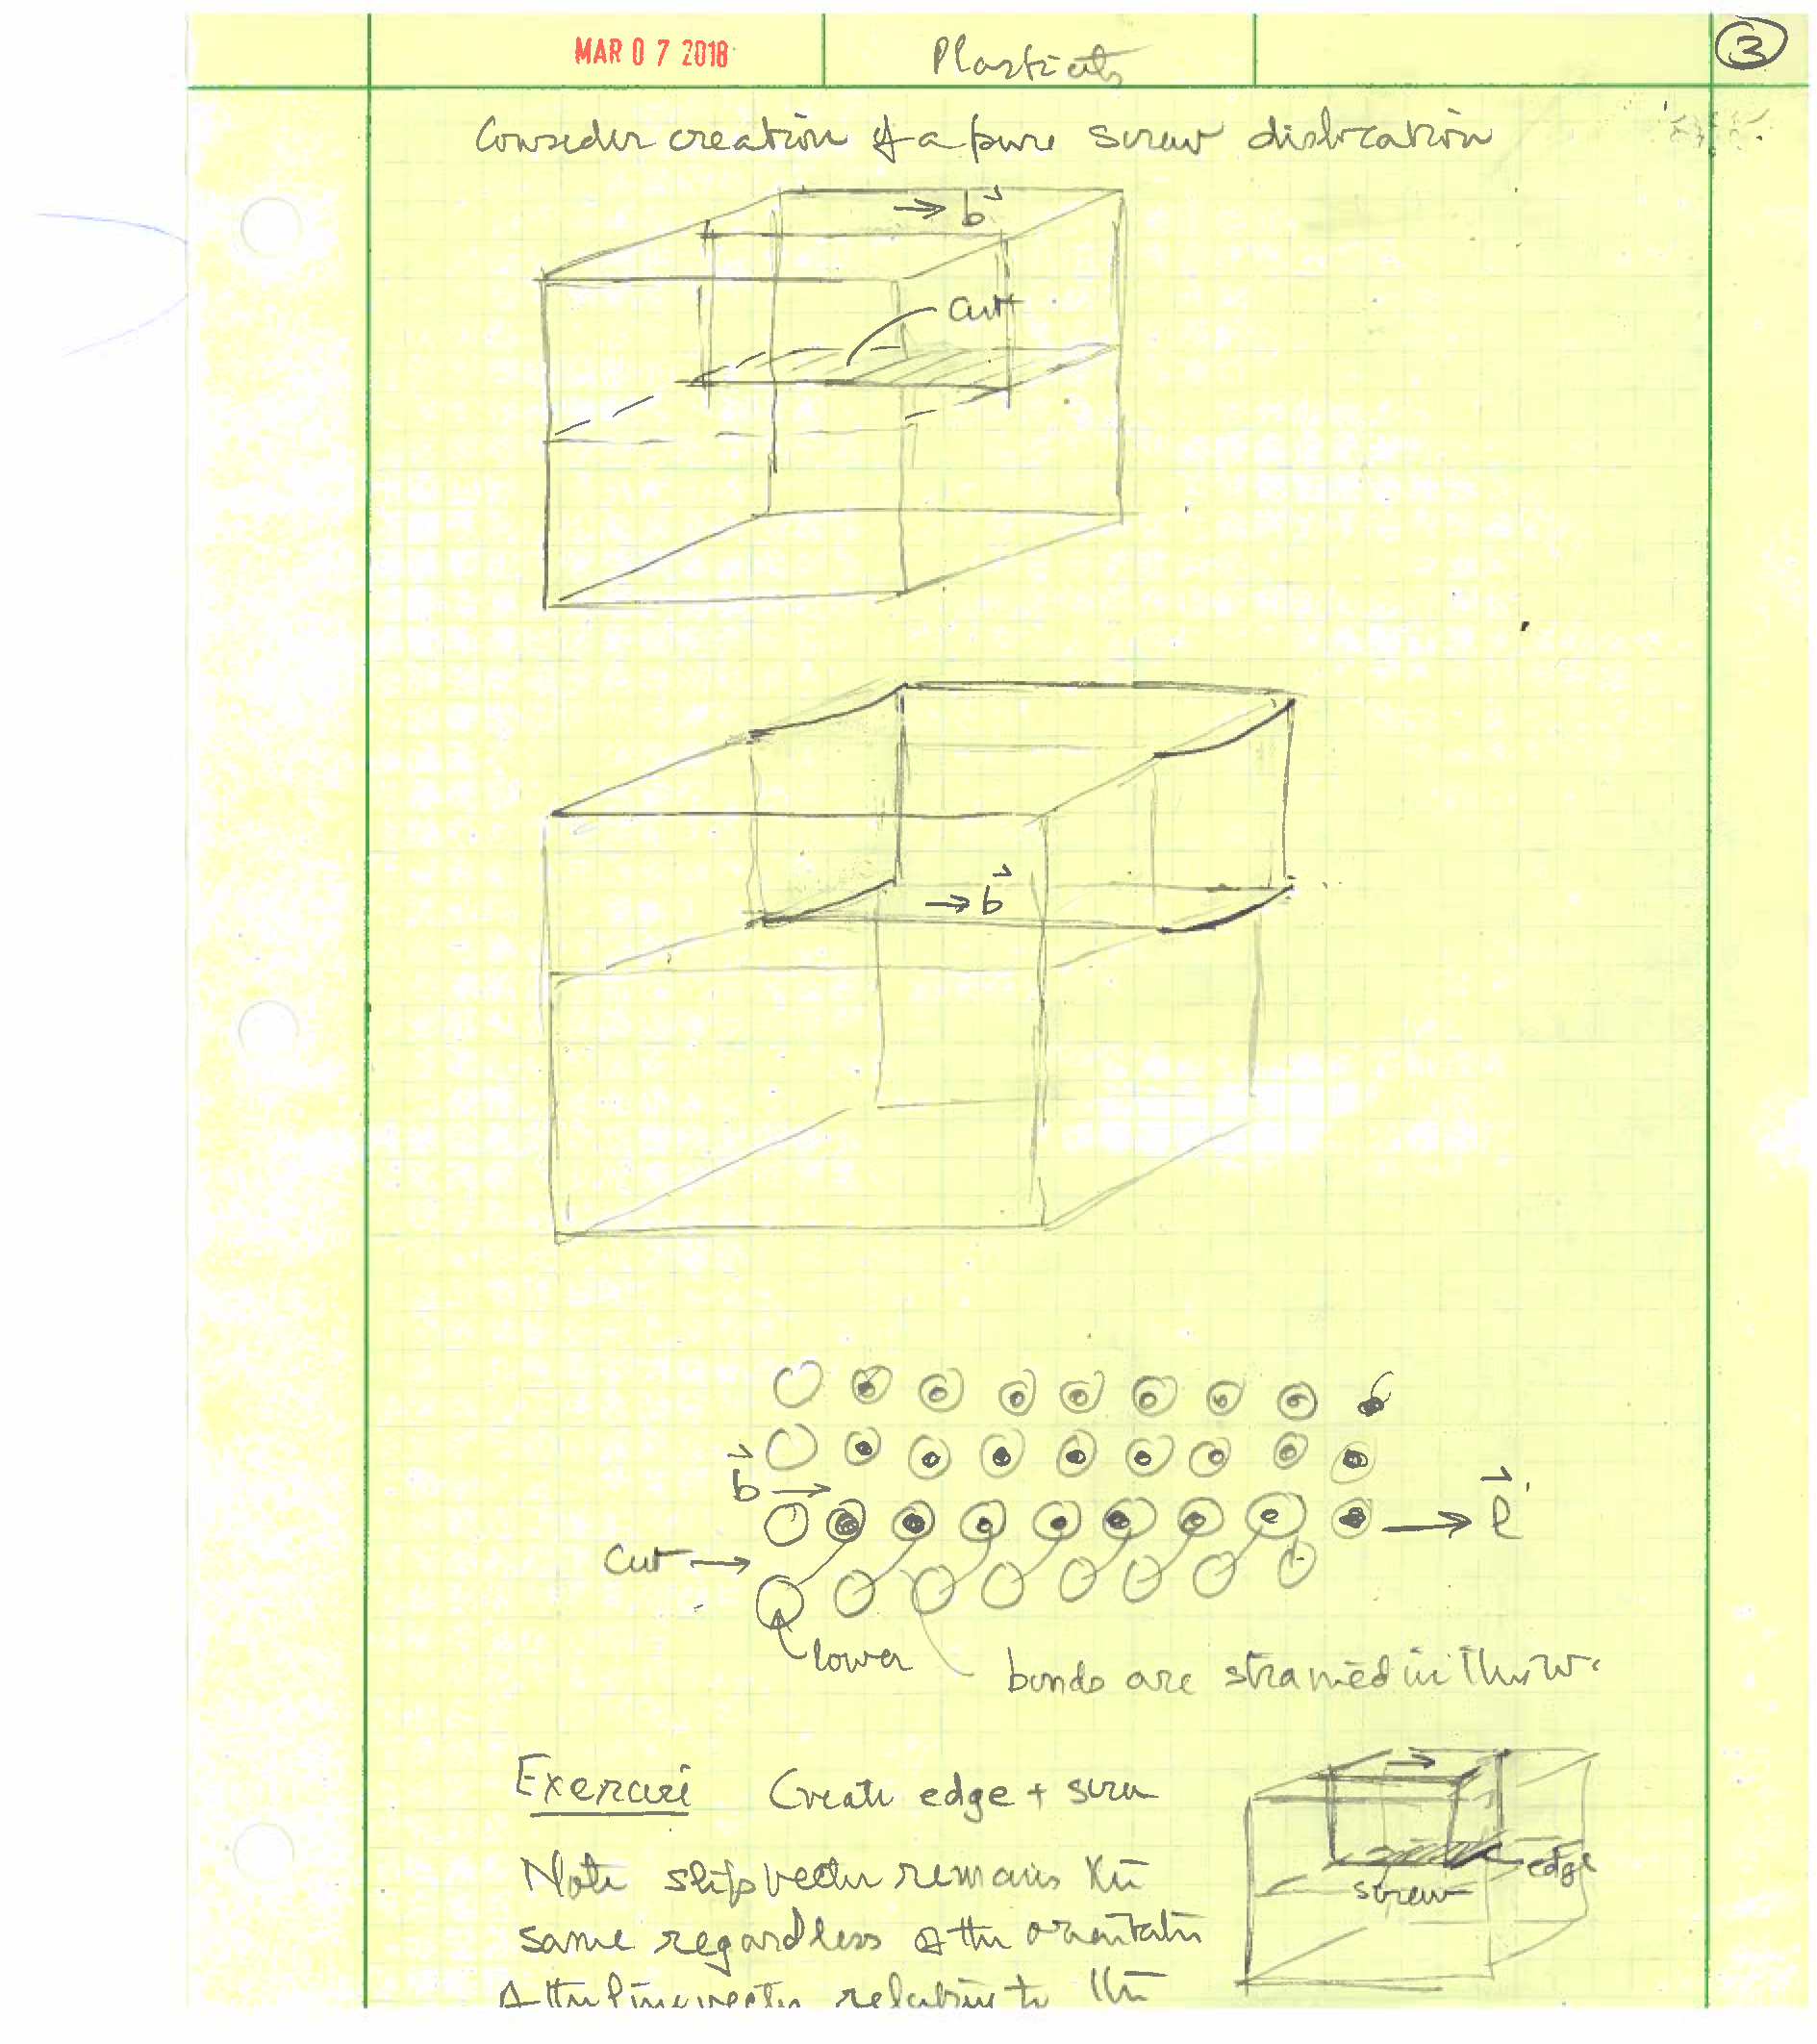
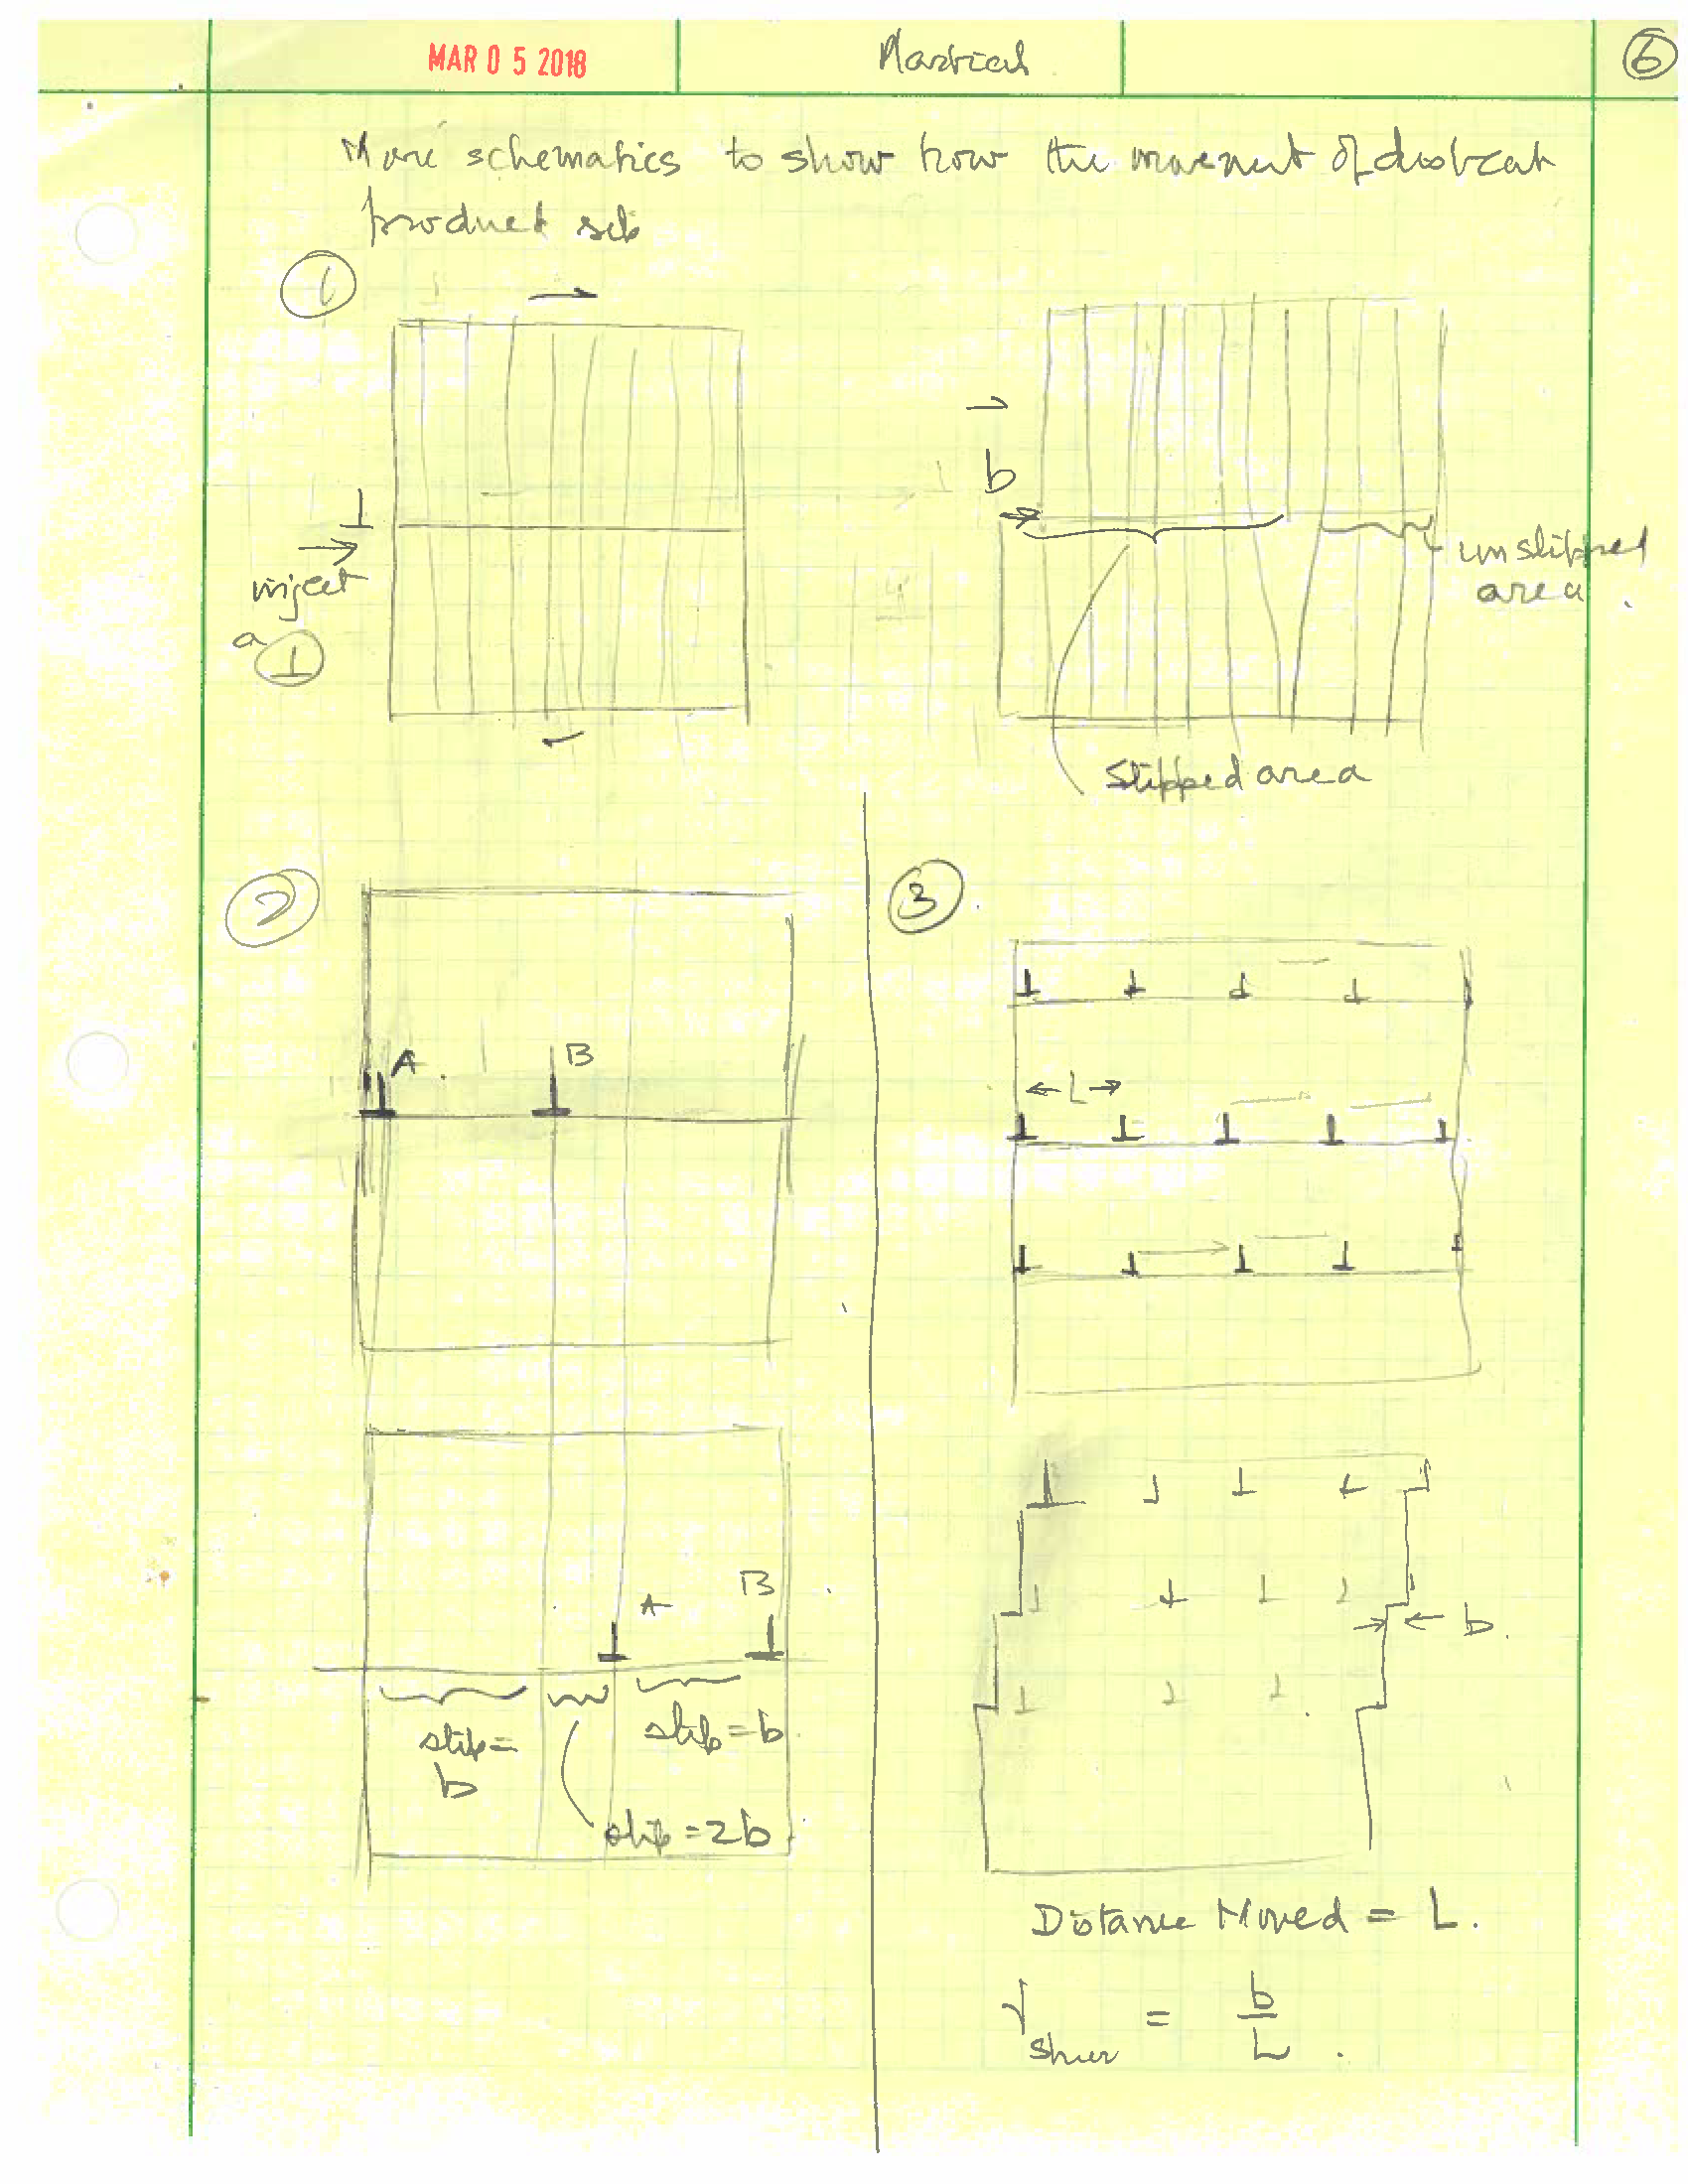
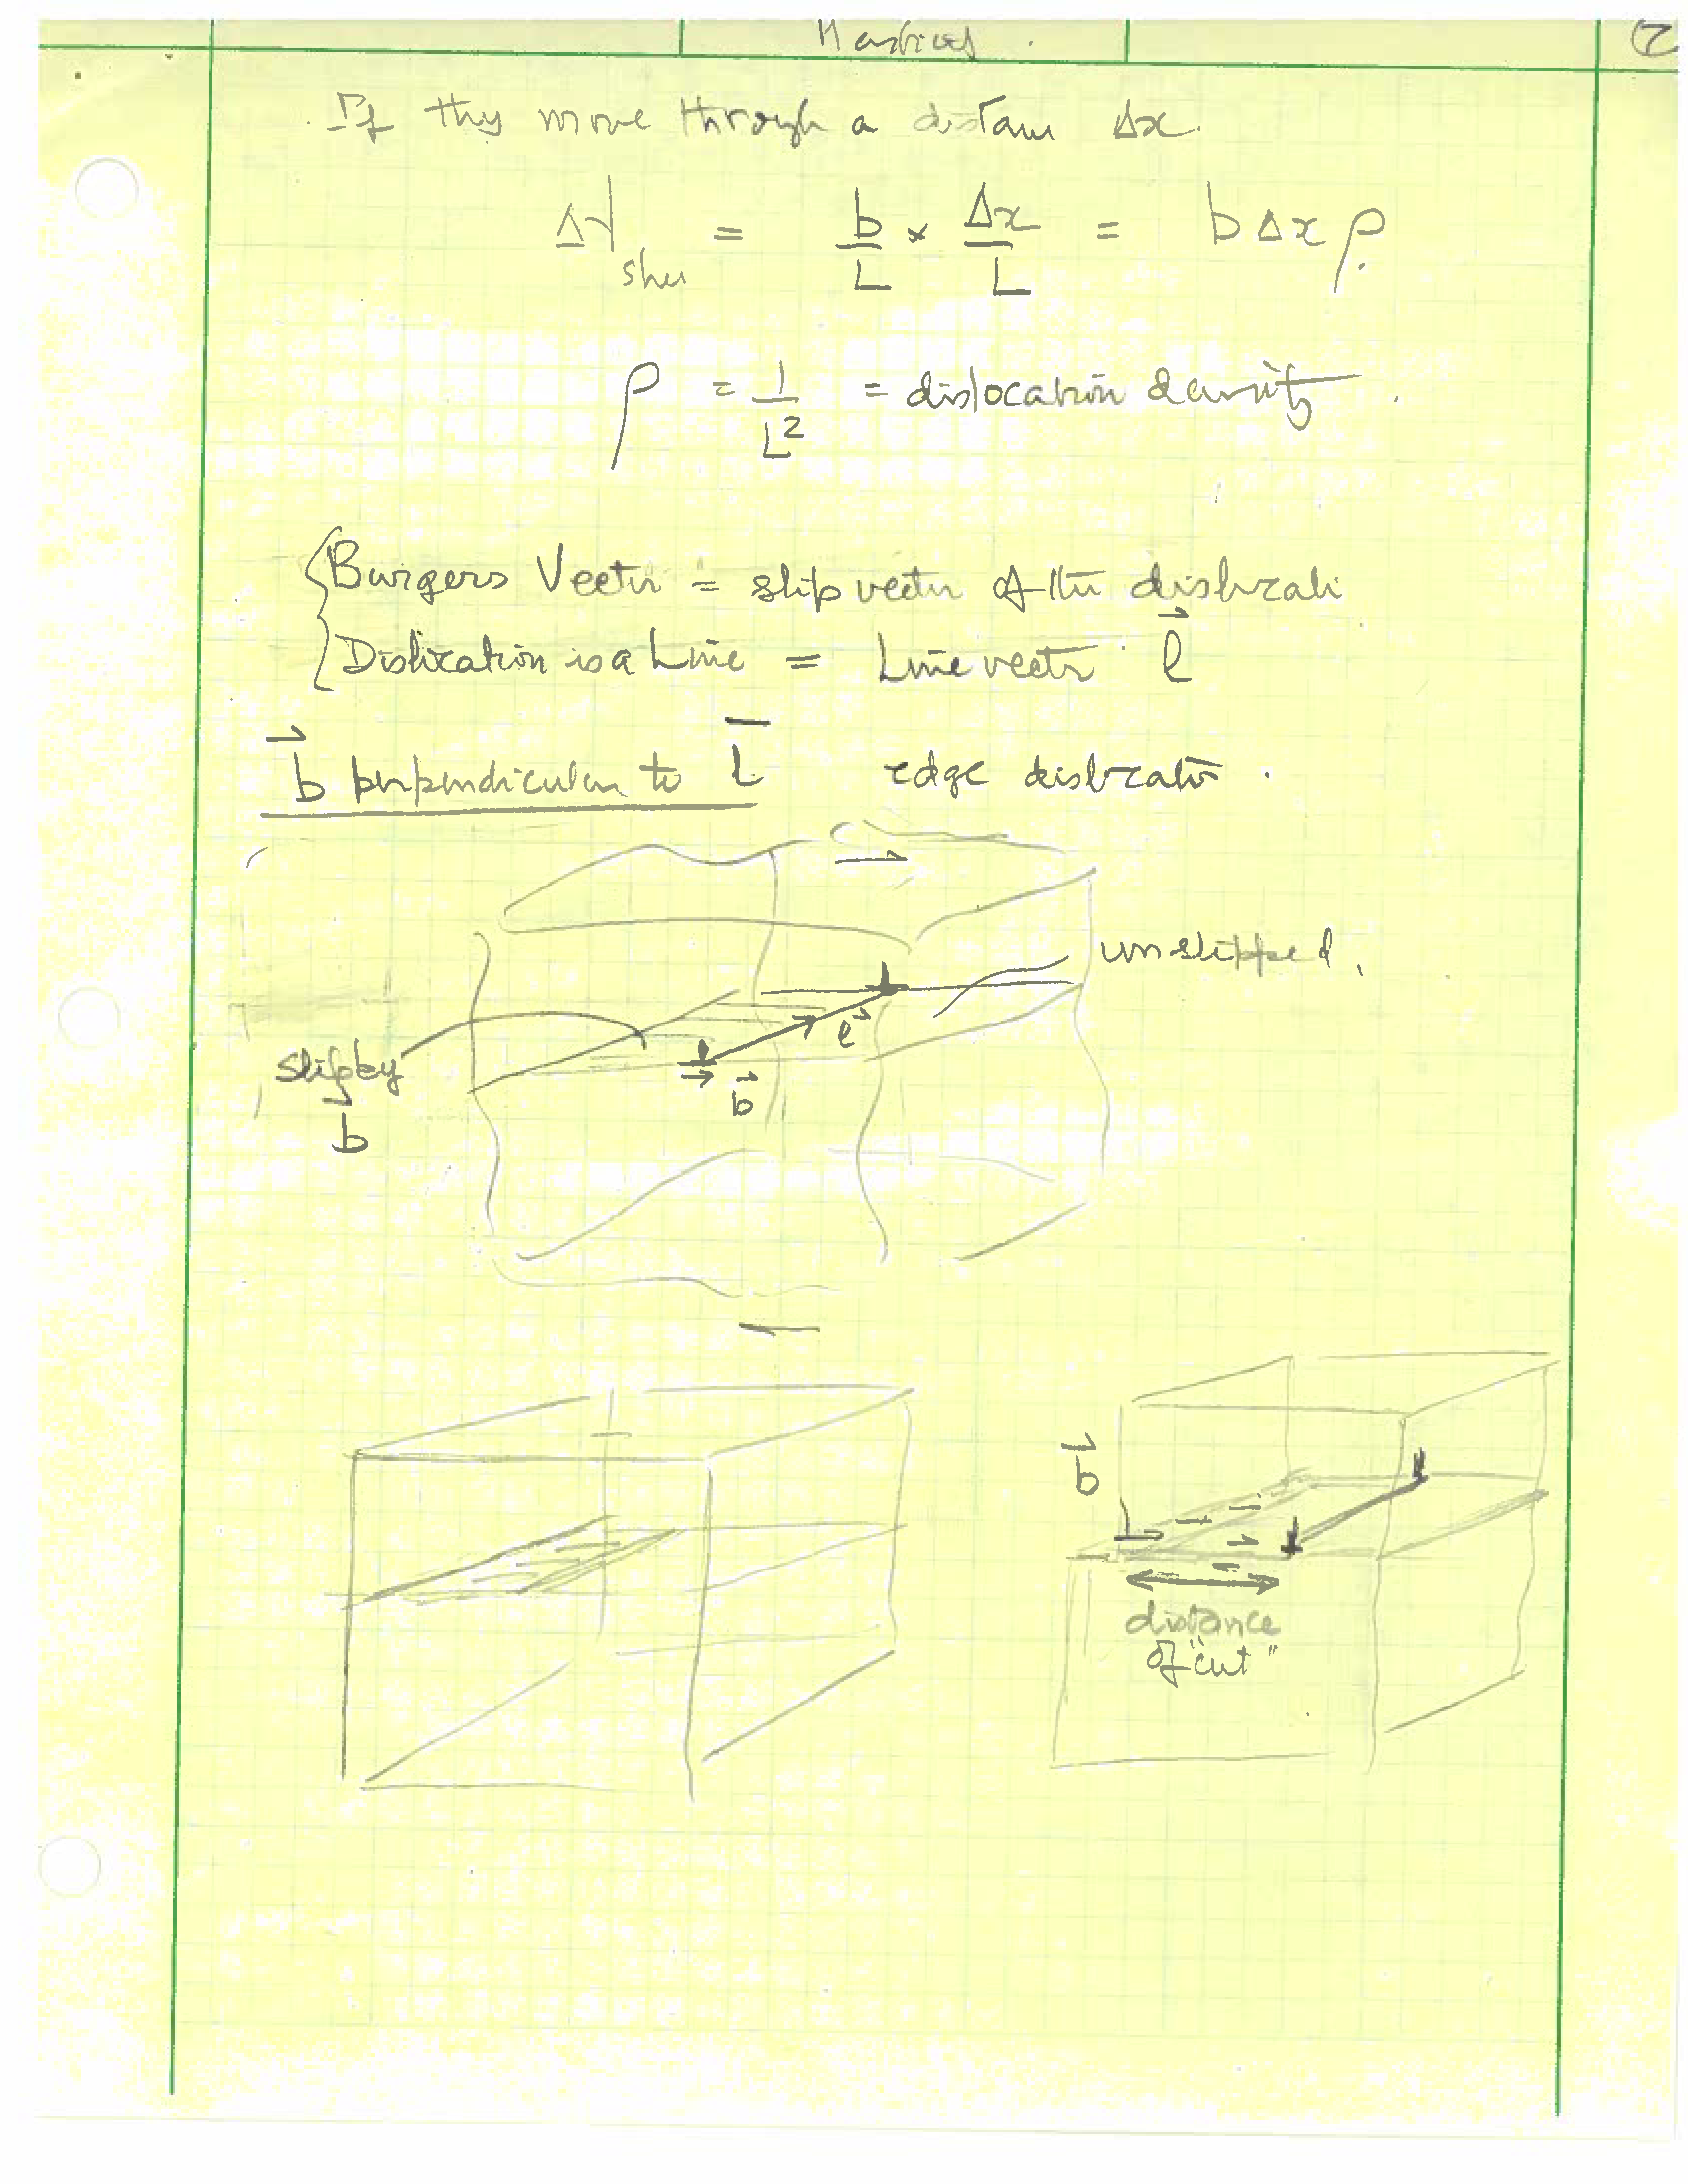
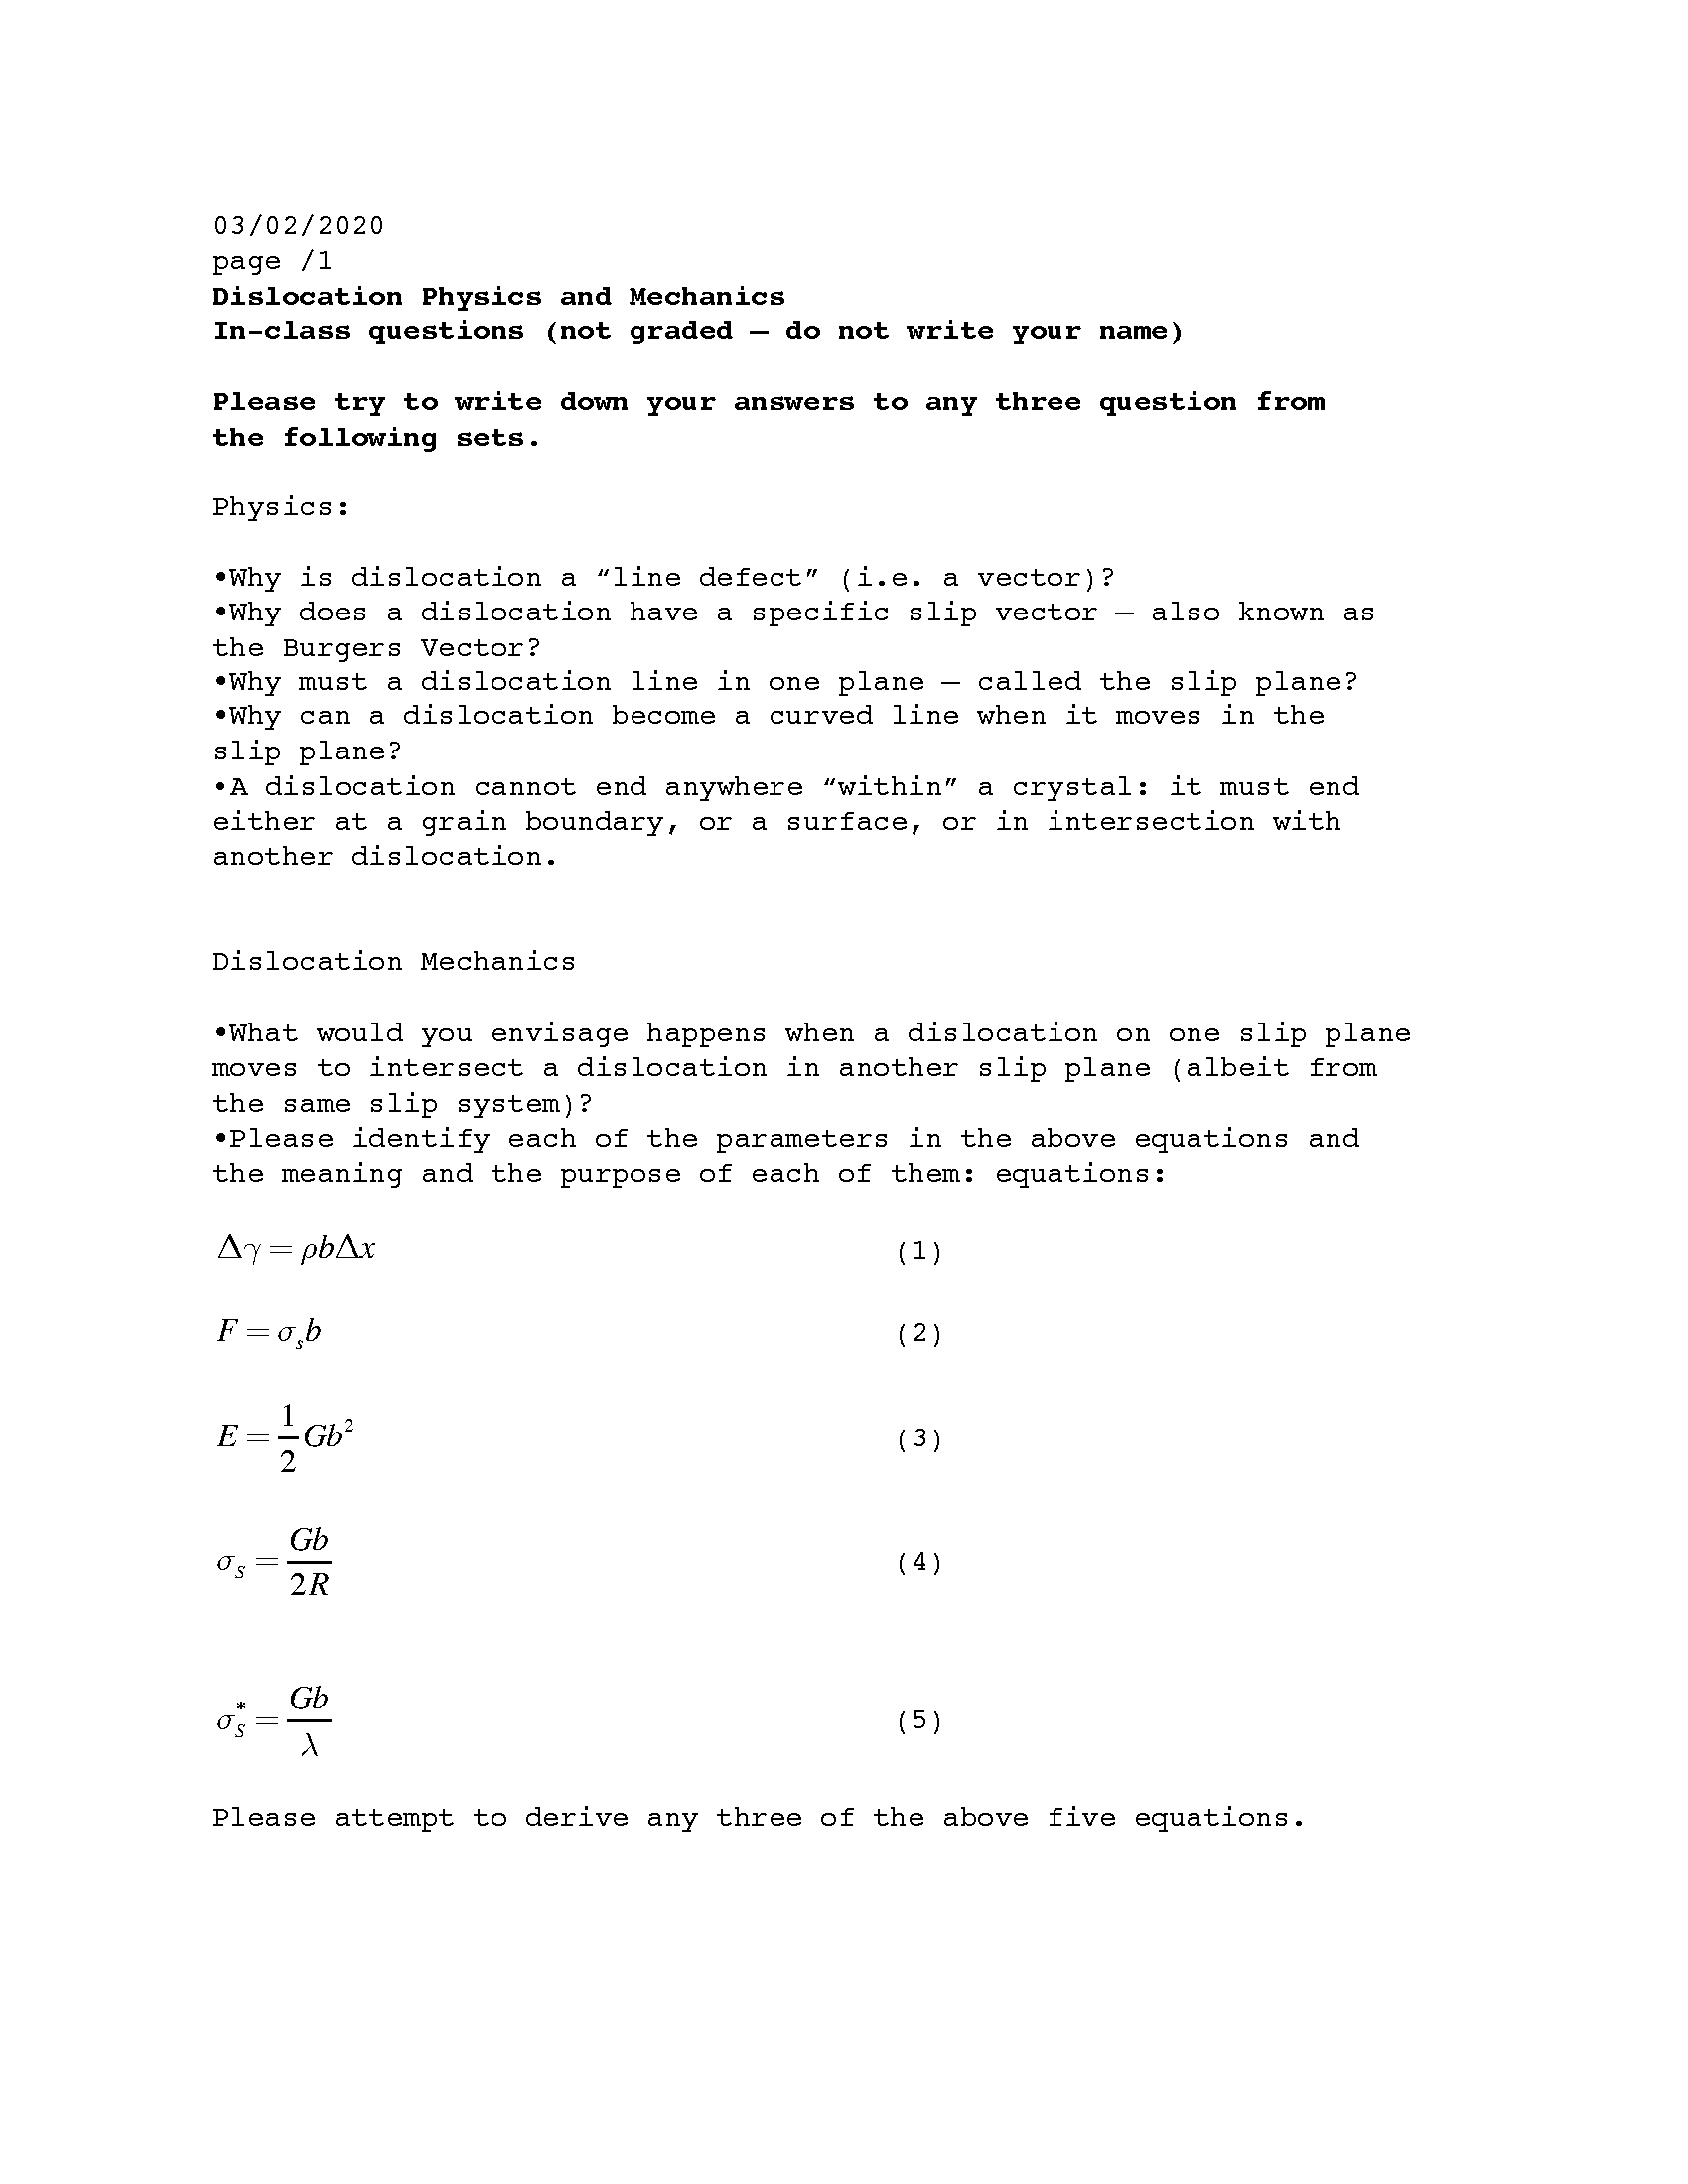
Explanations for the geometry of dislocations and their relationship to the crystals.
TOP
Practice HW problems
This is a recurring file that stores numerical analyses for the entire course. It is updated as needed.
Excel file for numerical analyses
The followind excel file contains the equations which are called out in the homework problems. The first sheet is devoted to "Elastity", the second sheet to "Plasticity" and so on.
Excel file for Equations
Problem 1.1
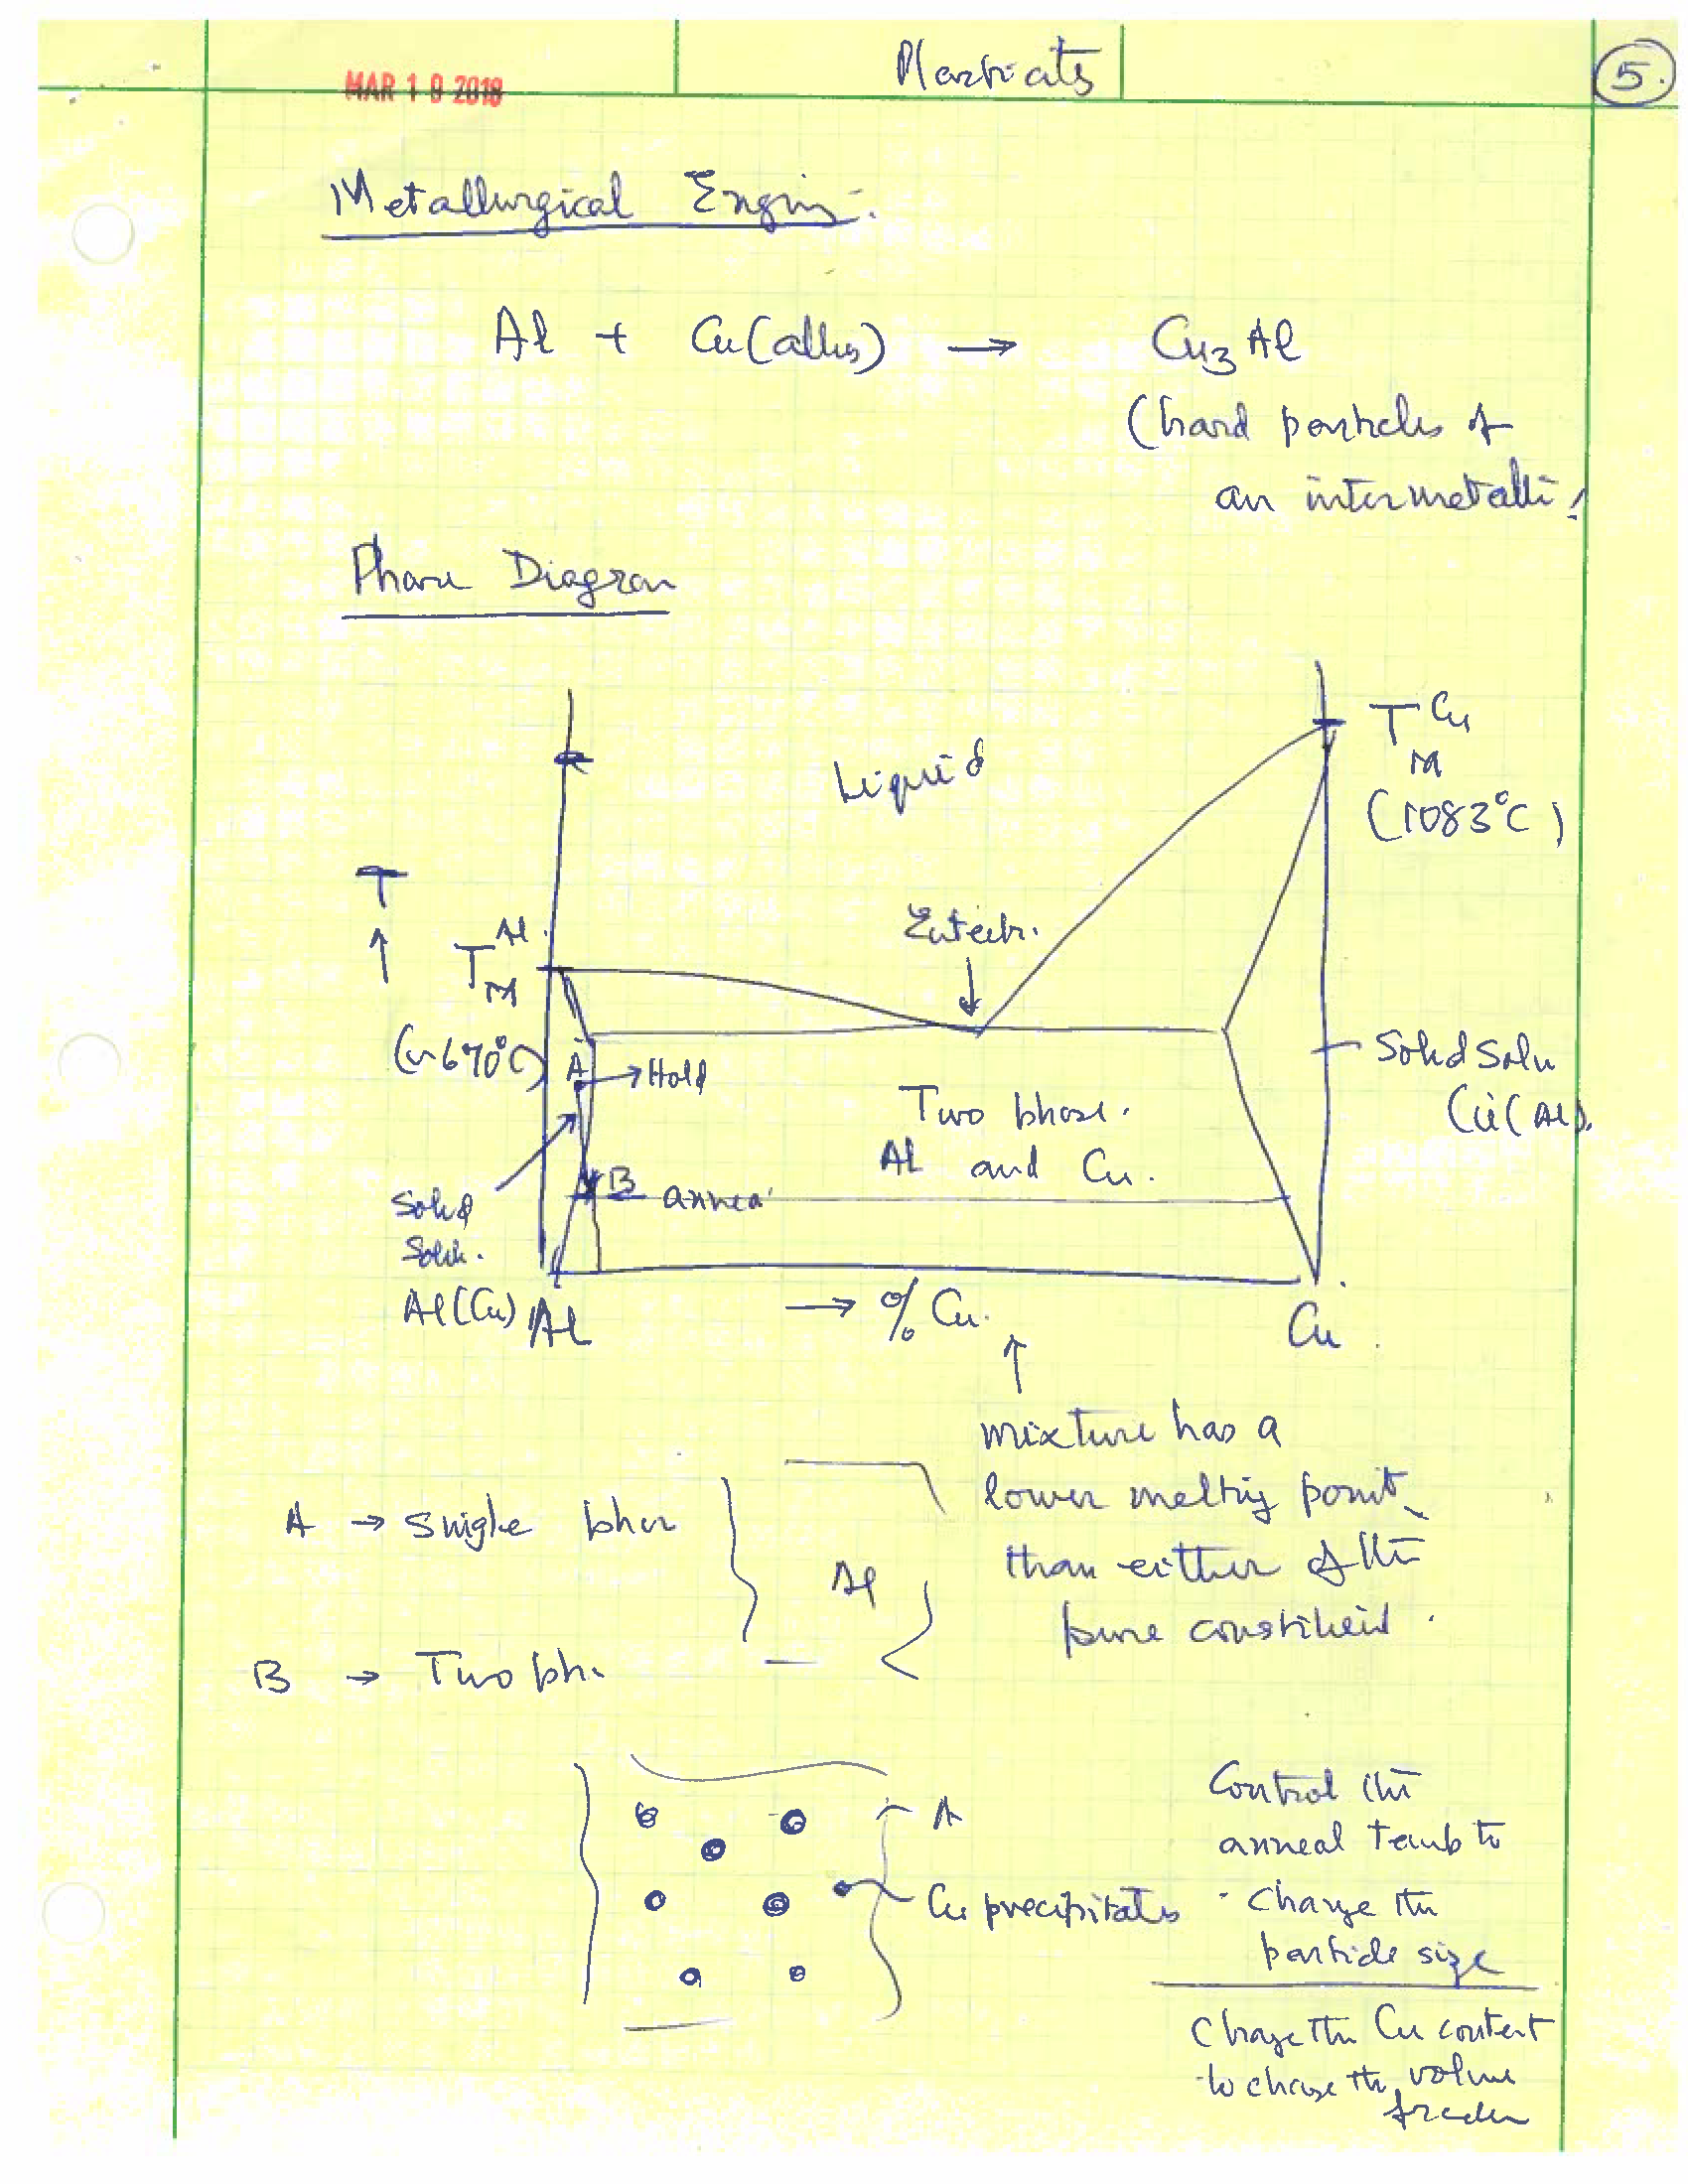
(i) The yield stress of metals can be increased by "alloying". The low yield stress of pure metals can be increased significantly by alloying. Carbon steels, hardened gold, different alloys of aluminum are examples. Now consider one metal where the yield stress of the pure form is E/10,000, while the alloy, of the same metal yields at E/500. Draw the stress strain curves for both of them in the same diagram, and show the yield stress in the form of 0.2% offset.
(ii) Repeat above, but now for two different metals, for example steel and aluminum, both with a yield stress of E/500, but with aluminum having a much lower modulus than steel (please look up and see how much lower it is)
Problem 1.2
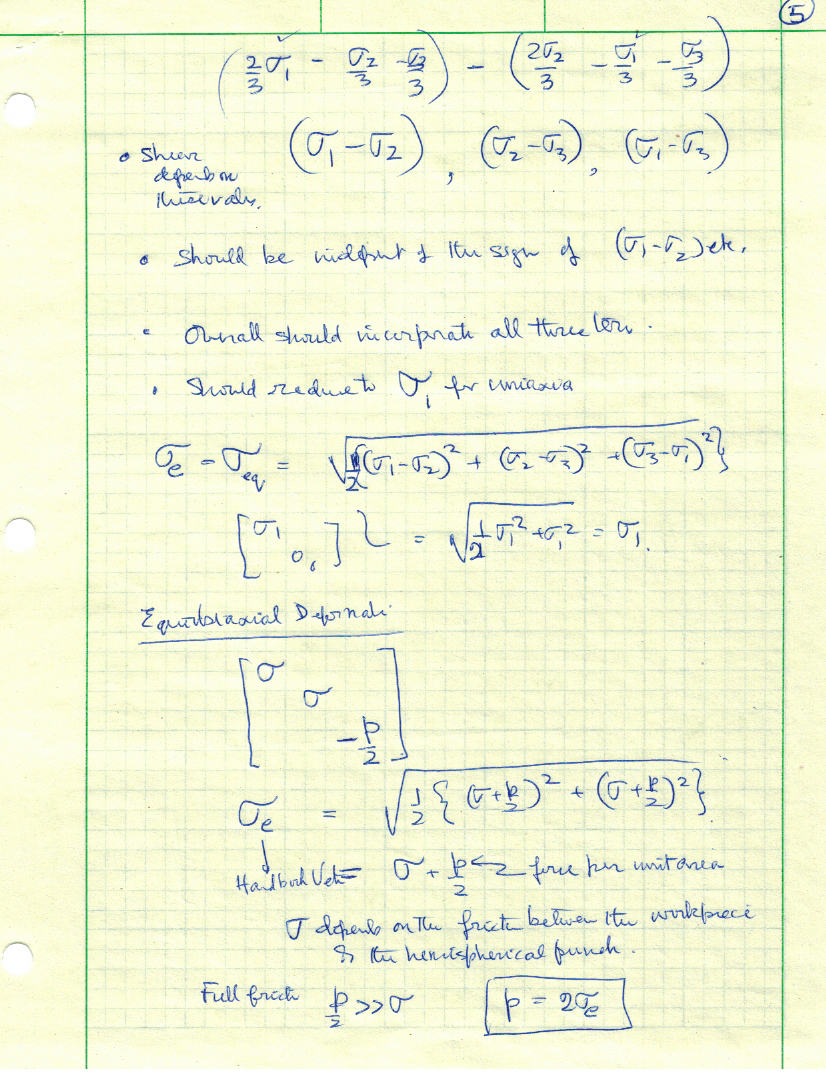
The equation for the effective stress (Eq. 2.1 in the excel file above) has a prefactor of a half inside the square root expression. Why?
Derive a similar equation for the equivalent strain with teh correct prefactor.
Problem 1.3
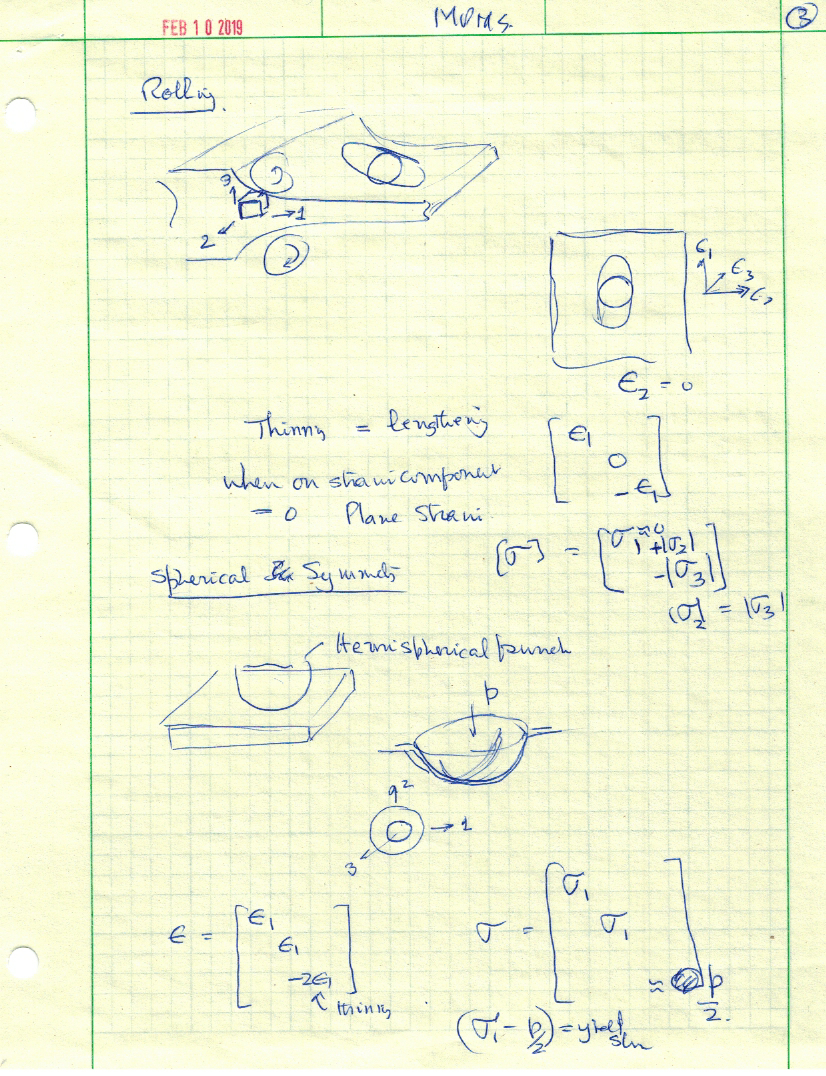
(i) All the principal strains in the deformation of a sheet can be described by the change in the shape of the circle drawn on the surface of the sheet. Explain how the change in the shape of the circles can give information about the change in the thickness of the sheet.
(ii) Give one example of plane strain deformation. Describe in detail as to how it is indeed determined to be such
(iii) A sheet is deformed in biaxial strain. The circles after the deformation grow to twice their initial diameter. If the intitial thickness of the sheet was 1 mm, what would it be after the biaxial stretching.
Problem 1.4
 TOP
TOP